Page 28 - Market Analysis Report of Optical Communications Field in China & Global market 2025
P. 28

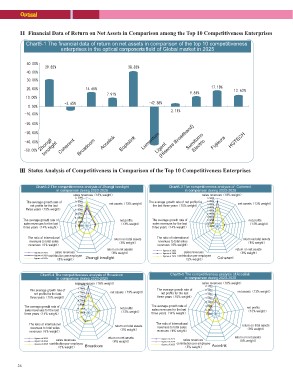
Ⅱ Financial Data of Return on Net Assets in Comparison among the Top 10 Competitiveness Enterprises
   Chart5-1 The financial data of return on net assets in comparison of the top 10 competitiveness
                       enterprises in the optical components field of Global market in 2025


                                                                                                LumentumLig(eHnist ense BroadbaSnudm)Eitloemctroic

                                                                                                                                                     Fujikura HGTECH

      ZhIonnngojliight    Coherent  Broadcom          Accelink        Eoptolink
    

Ⅲ Status Analysis of Competitiveness in Comparison of the Top 10 Competitiveness Enterprises

    Chart5-2 The competitiveness analysis of Zhongji Innolight                                                  Chart5-3 The competitiveness analysis of Coherent
                     in comparison during 2023-2025                                                                          in comparison during 2023-2025

                                 sales revenues˄18% weight˅                                                                                sales revenues˄18% weight˅


    The average growth rate of                          net assets˄13% weight˅                  The average growth rate of net profits for              net assets˄13% weight˅
       net profits for the last                                                                 the last three years˄15% weight˅                    
                                                                                                                                                    
    three years˄15% weight˅


    The average growth rate of                                       net profits               The average growth rate of                                       net profits
    sales revenues for the last                                              ˄13% weight˅              sales revenues for the last                                    ˄13% weight˅
    three years˄14% weight˅                                                                            three years˄14% weight˅                   

    The ratio of international                                                 return on total assets  The ratio of international                                                          return on total assets
     revenues to total sales                                                       ˄8% weight˅          revenues to total sales                                                                ˄8% weight˅
    revenues˄6% weight˅                                                                                revenues˄6% weight˅
                                                                        return on net assets                                                                                        return on net assets
    figures of 2023  sales revenues                                        ˄8% weight˅                          figures of 2023  sales revenues                                         ˄8% weight˅
                                                                                                                figures of 2024
    figures of 2024 contribution per employee        Zhongji Innolight                                          figures of 2025 contribution per employee           Coherent
    figures of 2025  ˄5% weight˅                                                                                                 ˄5% weight˅

             Chart5-4 The competitiveness analysis of Broadcom                                                  Chart5-5 The competitiveness analysis of Accelink
                          in comparison during 2023-2025                                                                    in comparison during 2023-2025

                                           salesrevenues˄18% weight˅                                                                sales revenues˄18% weight˅


    The average growth rate of                          net assets˄13% weight˅                  The average growth rate of                              net assets˄13% weight˅
       net profits for the last                                                                    net profits for the last               
                                                                                                                                          
    three years˄15% weight˅                                                                     three years˄15% weight˅


    The average growth rate of                                         net profits               The average growth rate of                                      net profits
    sales revenues for the last                                      ˄13% weight˅              sales revenues for the last                                    ˄13% weight˅
    three years˄14% weight˅                                                                    three years˄14% weight˅             

    The ratio of international                                       return on total assets            The ratio of international                                           return on total assets
     revenues to total sales                                             ˄8% weight˅                    revenues to total sales                                                 ˄8% weight˅
    revenues˄6% weight˅                                                                                revenues˄6% weight˅
                                                               return on net assets                                                                                   return on net assets
    figures of 2023  sales revenues                               ˄8% weight˅                          figures of 2023                 sales revenues                    ˄8% weight˅
    figures of 2024                                                                                    figures of 2024           contribution per employee
                     contribution per employee                                                         figures of 2025
    figures of 2025        ˄5% weight˅               Broadcom                                                                          ˄5% weight˅          Accelink

26
   23   24   25   26   27   28   29   30   31   32   33