Page 24 - Market Analysis Report of Optical Communications Field in China & Global market 2025
P. 24

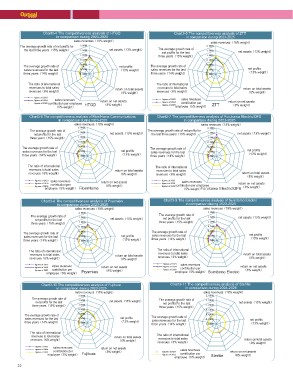
Chart3-4 The competitiveness analysis of HTGD                                                                Chart3-5 The competitiveness analysis of ZTT
                        in comparison during 2023-2025                                                                              in comparison during 2023-2025
                                         sales revenues˄18% weight˅
                                                                                                                                                            sales revenues˄18% weight˅
The average growth rate of net profits for                   
   the last three years˄15% weight˅                                                                                                                

                                                                        net assets˄13% weight˅               The average growth rate of                                  net assets˄13% weight˅
                                                                                                                net profits for the last                 
                                                             
                                                                                                             three years˄15% weight˅


    The average growth rate of                                    net profits                          The average growth rate of                                            net profits
    sales revenues for the last                                  ˄13% weight˅                         sales revenues for the last                                          ˄13% weight˅
    three years˄14% weight˅                                                                           three years˄14% weight˅                     

    The ratio of international                                                       return on total assets  The ratio of international                                                     return on total assets
     revenues to total sales                                                             ˄8% weight˅          revenues to total sales                                                           ˄8% weight˅
    revenues˄6% weight˅                                                                                      revenues˄6% weight˅
                                                                        return on net assets                                                                                   return on net assets
    figures of 2023  sales revenues                                        ˄8% weight˅                       figures of 2023 sales revenues                                       ˄8% weight˅
    figures of 2024                                                                                          figures of 2024 contribution per
                                                                                                             figures of 2025employee˄5% weight˅
    figures of 2025 contribution per employee                HTGD                                                                                                    ZTT
                     ˄5% weight˅

    Chart3-6 The competitiveness analysis of FiberHome Communications                                        Chart3-7 The competitiveness analysis of Furukawa Electric/OFS
                                 in comparison during 2023-2025                                                                 in comparison during 2023-2025
                                            sales revenues˄18% weight˅
                                                                                                                                                   sales revenues˄18% weight˅
                                                                                                                                                                     
    The average growth rate of                                    net assets˄13% weight˅               The average growth rate of net profits for                  net assets˄13% weight˅
       net profits for the last                                                                           the last three years˄15% weight˅
                                                                                                                                                                     
    three years˄15% weight˅


    The average growth rate of                                    net profits                          The average growth rate of                                            net profits
    sales revenues for the last                                  ˄13% weight˅                         sales revenues for the last                                          ˄13% weight˅
    three years˄14% weight˅                                                                           three years˄14% weight˅                     

    The ratio of international                                          return on total assets               The ratio of international                                                  return on total assets
     revenues to total sales                                               ˄8% weight˅                        revenues to total sales                                                       ˄8% weight˅
    revenues˄6% weight˅                                                                                      revenues˄6% weight˅

    figures of 2023 sales revenues                                      return on net assets                 figures  of  2023  sales revenues                                                return on net assets
    figures  of  22e0022m45 pclooynetreib˄u5ti%onwpeeirght˅                ˄8% weight˅                       figures  of  2024
    figures  of                                                                                              figures  of        contribution per employee                    Electric/OFS ˄8% weight˅
                                                             FiberHome                                                    2025
                                                                                                                                     ˄5% weight˅Furukawa

             Chart3-8 The competitiveness analysis of Prysmian                                               Chart3-9 The competitiveness analysis of Sumitomo Electric
                          in comparison during 2023-2025                                                                       in comparison during 2023-2025

                                            sales revenues˄18% weight˅                                                                                   sales revenues˄18% weight˅

                                                                                                       The average growth rate of                              
                                                                                                                net profits for the last                             
    The average growth rate of                                    net assets˄13% weight˅                                                                           net assets˄13% weight˅
       net profits for the last                                                                        three years˄15% weight˅
                                                             
    three years˄15% weight˅                                                                                                                                          

    The average growth rate of                                    net profits                          The average growth rate of                                            net profits
    sales revenues for the last                                  ˄13% weight˅                         sales revenues for the last                                          ˄13% weight˅
    three years˄14% weight˅                                                                           three years˄14% weight˅                     

    The ratio of international                                          return on total assets               The ratio of international                                                  return on total assets
     revenues to total sales                                               ˄8% weight˅                        revenues to total sales                                                       ˄8% weight˅
    revenues˄6% weight˅                                                                                      revenues˄6% weight˅

    figures of 2023  sales revenues                                     return on net assets                 figures of 2023 sales revenues                                              return on net assets
    figures of 2024                                                        ˄8% weight˅                       figures  of  220022e54mpclooyneterib˄u5ti%onwpeeirght˅                         ˄8% weight˅
    figures of 2025 contribution per                                                                         figures  of
                                                             Prysmian                                                                                                Sumitomo  Electric
                 employee˄5% weight˅

             Chart3-10 The competitiveness analysis of Fujikura                                                           Chart3-11 The competitiveness analysis of Sterlite
                          in comparison during 2023-2025                                                                              in comparison during 2024-2025
                                                                                                                                                        sales revenues˄18% weight˅
                                            sales revenues(18% weight)
                                                                                                                                                                   
                                                             2.0000

    The average growth rate of                               1.5000     net assets(13% weight)               The average growth rate of                                  net assets˄13% weight˅
       net profits for the last                              1.0000                                             net profits for the last                 
                                                                                                                                                         
    three years(15% weight)                                                                                  three years˄15% weight˅

                                                             0.5000

    The average growth rate of                                0.0000    net profits                          The average growth rate of                                            net profits
    sales revenues for the last                              -0.5000    (13% weight)                         sales revenues for the last                                          ˄13% weight˅
    three years(14% weight)                                  -1.0000                                         three years˄14% weight˅                     

    The ratio of international                                                       return on total assets  The ratio of international                                                     return on total assets
     revenues to total sales                                                            (8% weight)           revenues to total sales                                                          ˄8% weight˅
    revenues(6% weight)                                                                                      revenues˄6% weight˅
                                                                        return on net assets                                                                                   return on net assets
    figures of 2023  sales revenues                          Fujikura      (8% weight)                       figures of 2024    sales revenues                                    ˄8% weight˅
    figures of 2024  contribution per                                                                        figures of 2025    contribution per
    figures of 2025
                     employee(5% weight)
                                                                                                                          employee˄5% weight˅                        Sterlite

22
   19   20   21   22   23   24   25   26   27   28   29