Page 26 - Market Analysis Report of Optical Communications Field in China & Global market 2025
P. 26

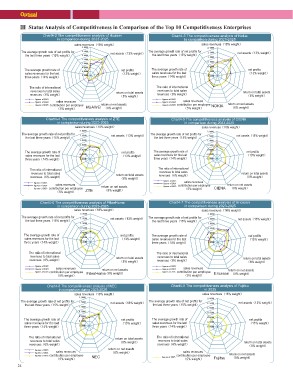
Ⅲ Status Analysis of Competitiveness in Comparison of the Top 10 Competitiveness Enterprises

    Chart4-2 The competitiveness analysis of Huawei                                                                  Chart4-3 The competitiveness analysis of Nokia
               in comparison during 2023-2025                                                                                  in comparison during 2023-2025

                                            sales revenues˄18% weight˅                                                                              sales revenues˄18% weight˅


The average growth rate of net profits for          net assets˄13% weight˅                        The average growth rate of net profits for       net assets˄13% weight˅
   the last three years˄15% weight˅                                                                  the last three years˄15% weight˅         


    The average growth rate of                                    net profits                     The average growth rate of                                        net profits
    sales revenues for the last                                   ˄13% weight˅                    sales revenues for the last                                      ˄13% weight˅
    three years˄14% weight˅                                                                      three years˄14% weight˅                     

    The ratio of international                                                                          The ratio of international
                                                                                                         revenues to total sales
    revenues to total sales                                             return on total assets          revenues˄6% weight˅                                                 return on total assets
    revenues˄6% weight˅                                                    ˄8% weight˅                                                                                          ˄8% weight˅

    figures of 2023  sales revenues                                                                     figures of 2023    sales revenues                      return on net assets
                                                                                                        figures of 2024                                           ˄8% weight˅
    figures of 2024                                          return on net assets                                          contribution per employee
                                                                                                                                 ˄5% weight˅
    figures of 2025 contribution per employee  HUAWEI ˄8% weight˅                                       figures  of  2025                             NOKIA
                        ˄5% weight˅

    Chart4-4 The competitiveness analysis of ZTE                                                                     Chart4-5 The competitiveness analysis of CIENA
             in comparison during 2023-2025                                                                                     in comparison during 2023-2025

                                            sales revenues˄18% weight˅                                                                              sales revenues(18% weight)

                                                                                                                                              2.0000
                                                                                                                                                    1.5000
The average growth rate of net profits for          net assets˄13% weight˅                        The average growth rate of net profits for  1.0000     net assets(13% weight)
   the last three years˄15% weight˅                                                                        the last three years(15% weight)
                                            

                                                                                                                                              0.5000

    The average growth rate of                                    net profits                     The average growth rate of                   0.0000                     net profits
    sales revenues for the last                                  ˄13% weight˅                    sales revenues for the last                 -0.5000                     (13% weight)
    three years˄14% weight˅                                                                      three years(14% weight)                     -1.0000

    The ratio of international                                         return on total assets           The ratio of international                                                     return on total assets
     revenues to total sales                                               ˄8% weight˅                   revenues to total sales                                                           (8% weight)
    revenues˄6% weight˅                                                                                 revenues(6% weight)
                                                          return on net assets                                                                                           return on net assets
    figures of 2023  sales revenues                          ˄8% weight˅                                figures of 2023          sales revenues
    figures of 2024                                                                                     figures of 2024    contribution per employee         CIENA (8% weight)
                                                                                                        figures of 2025
    figures of 2025 contribution per employee                                                                              (5% weight)
                     ˄5% weight˅               ZTE

    Chart4-6 The competitiveness analysis of FiberHome                                                           Chart4-7 The competitiveness analysis of Ericsson
                  in comparison during 2023-2025                                                                             in comparison during 2023-2025
                                   sales revenues˄18% weight˅
                                                                                                                                                    sales revenues˄18% weight˅


The average growth rate of net profits for          net assets˄13% weight˅                        The average growth rate of net profits for       net assets˄13% weight˅
   the last three years˄15% weight˅                                                                  the last three years˄15% weight˅         


    The average growth rate of                                    net profits                     The average growth rate of                                        net profits
    sales revenues for the last                                  ˄13% weight˅                    sales revenues for the last                                      ˄13% weight˅
    three years˄14% weight˅                                                                      three years˄14% weight˅                     

    The ratio of international                                                  return on total assets  The ratio of international                                                     return on total assets
     revenues to total sales                                                        ˄8% weight˅          revenues to total sales                                                           ˄8% weight˅
    revenues˄6% weight˅                                                                                 revenues˄6% weight˅
                                                                   return on net assets                                                                                   return on net assets
    figures of 2023  sales revenues                                                                     figures of 2023    sales revenues
    figures of 2024                                  FiberHome˄8% weight˅                               figures of 2024                                      Ericsson ˄8% weight˅

    figures of 2025 contribution per employee                                                           figures of 2025 contribution per employee
                     ˄5% weight˅                                                                                           ˄5% weight˅

    Chart4-8 The competitiveness analysis of NEC                                                                     Chart4-9 The competitiveness analysis of Fujitsu
             in comparison during 2023-2025                                                                                                      in 2025
                             sales revenues˄18% weight˅
                                                                                                                                                    sales revenues˄18% weight˅
                                              
                                                                                                                                                    
The average growth rate of net profits for          net assets˄13% weight˅                        The average growth rate of net profits for       net assets˄13% weight˅
    the last three years˄15% weight˅                                                                       the last three years˄15% weight˅         


    The average growth rate of                                    net profits                     The average growth rate of                                        net profits
    sales revenues for the last                                  ˄13% weight˅                    sales revenues for the last                                      ˄13% weight˅
    three years˄14% weight˅                                                                      three years˄14% weight˅                     

    The ratio of international                                  return on total assets                  The ratio of international                                              return on total assets
     revenues to total sales                                        ˄8% weight˅                          revenues to total sales                                                   ˄8% weight˅
    revenues˄6% weight˅                                                                                 revenues˄6% weight˅
                                                          return on net assets
    figures of 2023  sales revenues                          ˄8% weight˅                                                   sales revenues                      return on net assets
    figures of 2024                                                                                                                                               ˄8% weight˅
    figures of 2025 contribution per employee                                                                              contribution per employee
                     ˄5% weight˅                     NEC                                                figures of 2025          ˄5% weight˅          Fujitsu

24
   21   22   23   24   25   26   27   28   29   30   31