Page 29 - Market Analysis Report of Optical Communications Field in China & Global market 2025
P. 29

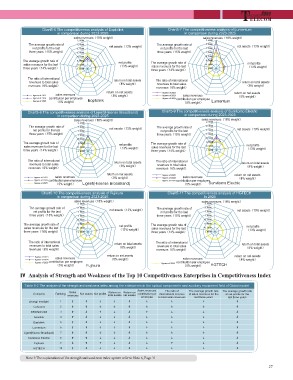
Chart5-6 The competitiveness analysis of Eoptolink                                                        Chart5-7 The competitiveness analysis of Lumentum
                     in comparison during 2023-2025                                                                              in comparison during 2023-2025
                                      sales revenues˄18% weight˅
                                                                                                                                                      sales revenues˄18% weight˅


The average growth rate of                                      net assets˄13% weight˅                      The average growth rate of                             net assets˄13% weight˅
   net profits for the last                                                                                    net profits for the last        
                                                                                                                                               
three years˄15% weight˅                                                                                            three years˄15% weight˅


The average growth rate of                                          net profits                       The average growth rate of                                        net profits
sales revenues for the last                                       ˄13% weight˅                      sales revenues for the last                                     ˄13% weight˅
three years˄14% weight˅                                                                             three years˄14% weight˅                   

The ratio of international                                                       return on total assets     The ratio of international                                                  return on total assets
 revenues to total sales                                                            ˄8% weight˅              revenues to total sales                                                        ˄8% weight˅
revenues˄6% weight˅                                                                                         revenues˄6% weight˅
                                                                          return on net assets                                                                                   return on net assets
                         sales revenues                                      ˄8% weight˅                           figures of 2023                                                  ˄8% weight˅
                   contribution per employee
figures of 2023                                          Eoptolink                                                 figures of 2024    sales revenues
figures of 2024          ˄5% weight˅
figures of 2025                                                                                                    figures of 2025 contribution per employee     Lumentum
                                                                                                                                      ˄5% weight˅

Chart5-8 The competitiveness analysis of Ligent(Hisense Broadband)                                                 Chart5-9 The competitiveness analysis of Sumitomo Electric
                        in comparison during 2023-2025                                                                                in comparison during 2023-2025
                                           sales revenues˄18% weight˅
                                                                                                                                                sales revenues˄18% weight˅


The average growth rate of                                      net assets˄13% weight˅                      The average growth rate of                             net assets˄13% weight˅
   net profits for the last                                                                                    net profits for the last        
                                                                                                                                               
three years˄15% weight˅                                                                                            three years˄15% weight˅            


The average growth rate of                                         net profits                       The average growth rate of                                        net profits
sales revenues for the last                                       ˄13% weight˅                      sales revenues for the last                                     ˄13% weight˅
three years˄14% weight˅                                                                             three years˄14% weight˅                   

The ratio of international                                             return on total assets               The ratio of international                                              return on total assets
 revenues to total sales                                                  ˄8% weight˅                        revenues to total sales                                                   ˄8% weight˅
revenues˄6% weight˅                                                                                         revenues˄6% weight˅

                           sales revenues                              return on net assets                        figures  of  2023        sales revenues                             return on net assets
                                                                       ˄8% weight˅                                 figures  of  2024                                                      ˄8% weight˅
figures of 2023                                                                                                    figures  of  2025  contrib˄u5ti%onwpeeirgehmt˅ployeeSumitomo
                                                                                                                                                                                 Electric
figures of 2024 contribution per employee     Ligent(Hisense Broadband)
figures of 2025            ˄5% weight˅

         Chart5-10 The competitiveness analysis of Fujikura                                                        Chart5-11 The competitiveness analysis of HGTECH
                      in comparison during 2023-2025                                                                                             in 2025
                                       sales revenues˄18% weight˅
                                                                                                                                                salesre venues˄18% weight˅
                                                       

The average growth rate of                                      net assets˄13% weight˅                      The average growth rate of                             net assets˄13% weight˅
   net profits for the last                                                                                    net profits for the last        
                                                                                                                                               
three years˄15% weight˅                                                                                            three years˄15% weight˅            


The average growth rate of                                          net profits                       The average growth rate of                                        net profits
sales revenues for the last                                       ˄13% weight˅                      sales revenues for the last                                     ˄13% weight˅
three years˄14% weight˅                                                                             three years˄14% weight˅             

The ratio of international                                                   return on total assets         The ratio of international                                                 return on total assets
 revenues to total sales                                                         ˄8% weight˅                 revenues to total sales                                                       ˄8% weight˅
revenues˄6% weight˅                                                                                         revenues˄6% weight˅
                                                                       return on net assets                                                                                      return on net assets
figures  of  2023        sales revenues                                   ˄8% weight˅                                                 sales revenues                                ˄8% weight˅
figures  of  2024  contribution per employee
figures  of  2025          ˄5% weight˅                Fujikura                                                     figures of 2025    contribution per employee  HGTECH
                                                                                                                                            ˄5% weight˅

Ⅳ Analysis of Strength and Weakness of the Top 10 Competitiveness Enterprises in Competitiveness Index

Table 5-2 The analysis of the strength and weakness index among the enterprises in the optical components and auxiliary equipment field of Global market

    Company                Ranking    Sales   Net assets  Net profits  Return on     Return on   Sales revenues           The ratio of      The average growth rate    The average growth rate
Zhongji Innolight                   revenues                           total assets  net assets  contribution per   international revenue   of sales revenues for the     of net profits for the
                                                                                                                   to total sales revenues                                   last three years
                                                                                                     employee                                     last three years
                                                                                                                                                                                      į
                             ĭ                       į   į            į             į                   į                  į                              į

Coherent                     ĭ                       ĭ   į            į             į                   į                  į                   į                                į

BROADCOM                     ĭ                       į   ĭ            į             į                   ĭ                  į                   į                                į

Accelink                     ĭ                       į   į            į             į                   į                  į                   į                                į

Eoptolink                    ĭ                       į   į            į             į                   į                  į                   į                                į

Lumentum                     ĭ                       į   į            į             į                   į                  į                   į                                į

Ligent(Hisense Broadband)          ĭ                 į   į            į             į                   į                  į                   į                                į

Sumitomo Electric  ĭ                                 ĭ   į            į             į                   į                  į                   į                                į

Fujikura                     į                       ĭ   ĭ            į             į                   į                  ĭ                   į                                į

HGTECH                        ĭ                     į   į            į             į                   į                  į                   į                                į

Note 3:The explanations of the strength and weakness index system refer to Note 6, Page 31

                                                                                                                                                                                                             27
   24   25   26   27   28   29   30   31   32   33   34