Page 27 - Market Analysis Report of Optical Communications Field in China & Global market 2025
P. 27

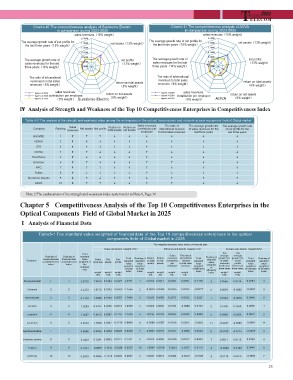
Chart4-10 The competitiveness analysis of Sumitomo Electric                                                                                Chart4-11 The competitiveness analysis of ADVA
                   in comparison during 2023-2025                                                                                                        in comparison during 2023-2025

                                                           sales revenues˄18% weight˅                                                                                          sales revenues˄18% weight˅


The average growth rate of net profits for                                       net assets˄13% weight˅              The average growth rate of net profits for                                     net assets˄13% weight˅
   the last three years˄15% weight˅                                                                                     the last three years˄15% weight˅                        


The average growth rate of                                                               net profits                     The average growth rate of                                                               net profits
sales revenues for the last                                                             ˄13% weight˅                    sales revenues for the last                                                             ˄13% weight˅
three years˄14% weight˅                                                                                                 three years˄14% weight˅                                

The ratio of international                                                                  return on total assets                 The ratio of international                                                            return on total assets
 revenues to total sales                                                                       ˄8% weight˅                          revenues to total sales                                                                 ˄8% weight˅
revenues˄6% weight˅                                                                                                                revenues˄6% weight˅
                                                                                                                                                                                                            return on net assets
figures                   of  2023        sales revenues                           return on net assets                            figures of 2023       sales revenues
figures                   of  2024  contribution per employee                                                                                                                                  ADVA ˄8% weight˅
figures                   of  2025                                        Electric˄8% weight˅                                      figures of 2024 contribution per employee
                                         ˄5% weight˅ Sumitomo                                                                      figures of 2025       ˄5% weight˅

Ⅳ Analysis of Strength and Weakness of the Top 10 Competitiveness Enterprises in Competitiveness Index

Table 4-2 The analysis of the strength and weakness index among the enterprises in the optical transmission and network access equipment field of Global market

Company                                    Ranking    Sales   Net assets  Net profits  Return on     Return on   Sales revenues           The ratio of           The average growth rate          The average growth rate
HUAWEI                                              revenues                           total assets  net assets  contribution per   international revenue        of sales revenues for the           of net profits for the
                                                                                                                                   to total sales revenues                                              last three years
                                                                                                                     employee                                          last three years
                                                                                                                                                                                                                 į
                                           ĭ                 ĭĭ                            į        į                  į                  į                                    į

NOKIA                                      į                 ĭį                            į        į                  į                  į                                   į                                į

ZTE                                        ĭ                 ĭį                            į        į                  ĭ                  į                                   į                                į

CIENA                                      ĭ                 ĭį                            į        į                  ĭ                  į                                   į                                į

FiberHome                                  ĭ                 įį                            į        į                  ĭ                  į                                   į                                į

Ericsson                                   ĭ                 ĭį                            į        į                  ĭ                  ĭ                                   į                                į

NEC                                        į                 ĭĭ                            į        į                  ĭ                  į                                   į                                į

Fujitsu                                    ĭ                 įį                            į        į                  ĭ                  į                                   į                                į

Sumitomo Electric  į                                         ĭį                            ĭ        ĭ                  į                  ĭ                                   ĭ                                ĭ

ADVA                                        į               ĭĭ                            į        į                  ĭ                  ĭ                                   į                                į

    Note 2:The explanations of the strength and weakness index system refer to Note 6, Page 31

Chapter 5 Competitiveness Analysis of the Top 10 Competitiveness Enterprises in the
Optical Components Field of Global Market in 2025

Ⅰ Analysis of Financial Data

           Table5-1 The standard value weighted of financial data of the Top 10 competitiveness enterprises in the optical
                                                                  components field of Global market in 2025

                                                                                                                               The weighted standard value indexs of financial data

                                                                                    Scale sub-factors˄weight 44%˅                  Efficiency sub-factors˄weight 27%˅                             Increase sub-factors˄weight 29%˅

                                                              Total                                                                                                                               The The

                              Ranking of   Ranking of         standard                                                                         Sales     The ratio of                 Ranking of    average       average
                                                                                                                                            revenues                                   standard   growth rate   growth rate
Company                       comprehensive financial data    value         Sales     Net    Net     Total Ranking of Return       Return  contribution  international Total                                                      Total    Ranking of
                                                                          revenues  assets  profits                                on net                                                value      of sales        of net     standard     standard
                          competitiveness competitiveness weighted of                                standard standard on total    assets        per     revenue standard              weighted    revenues        profits
                                                                            weight  weight  weight                                          employee                                              for the last  for the last      value        value
                                    index           index     the            18%     13%     13%     value       value assets      weight                to total sales value               of    three years   three years    weighted     weighted
                                                                                                                                     8%      weight                                   efficiency                              of increase  of increase
                                                              financial                              weighted weighted                                   revenues weighted                           weight        weight
                                                                                                                                                                                         index                                    index        index
                                                              data                                   of scale of scale                                                 of efficiency

                                                                                                     index       index weight                            weight        index

                                                                                                                           8%              5% 6%                                                  14%           15%

Zhongji Innolight                   1               1         2.5710 1.9920 0.1624 0.2227 2.3771                   1 0.0152 0.0211 0.0465 0.0351 0.1178                               2           0.0546 0.0214 0.0761                     3

Coherent                            2               2         2.2272 1.9713 0.3343 -0.0500 2.2556                  2 -0.0024 -0.0049 -0.0035 0.0032 -0.0077                           8           0.0054 -0.0262 -0.0207                   8

BROADCOM                            3               3         2.1172 1.2396 0.1856 0.3597 1.7849                   3 0.0032 0.0089 0.2873 0.0232 0.3227                               1           0.0144 -0.0048 0.0096                    5

Accelink                            4               4         1.3093 0.9132 0.0655 0.0273 1.0059                   5 0.0023 0.0035 0.0163 -0.0088 0.0134                              5           0.1400 0.1500 0.2900                     1

Eoptolink                           5               5         1.3087 0.9613 0.0587 0.1216 1.1416                   4 0.0195 0.0283 0.0086 0.0290 0.0854                               3           0.0462 0.0355 0.0817                     2

Lumentum                            6               6         0.8559 1.1058 0.0462 -0.1716 0.9804                  6 -0.0099 -0.0367 -0.0018 0.0201 -0.0282                           11 -0.0297 -0.0665 -0.0962                           11

Ligent Hisense Broadband            7               7         0.4968 0.5036 0.0269 0.0025 0.5330                   7 -0.0001 -0.0011 0.0121 -0.0065 0.0044                            6 -0.0180 -0.0225 -0.0405                            9

Sumitomo Electric                   8               8         0.2442 0.1241 0.0943 0.0127 0.2311                   9 0.0028 0.0050 -0.0235 0.0167 0.0009                              7           0.0011 0.0112 0.0122                     4

Fujikura                            9               9         0.2433 0.0857 0.1032 0.0326 0.2215 10 0.0045 0.0109 -0.0221 0.0237 0.0170 4 -0.0086 0.0133 0.0048                                                                            6

HGTECH                              10              10        0.2419 0.3606 -0.1178 0.0209 0.2637                  8 0.0034 0.0073 -0.0024 -0.0212 -0.0129                            9           -0.0118 0.0029 -0.0089                   7

                                                                                                                                                                                                                                               25
   22   23   24   25   26   27   28   29   30   31   32