Page 32 - Market Analysis Report of Optical Communications Field in China & Global market 2025
P. 32

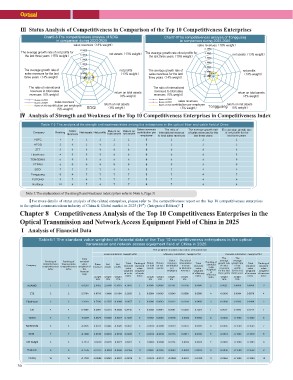
Ⅲ Status Analysis of Competitiveness in Comparison of the Top 10 Competitiveness Enterprises

                      Chart7-8 The competitiveness analysis of SDGI                                                                 Chart7-9The competitiveness analysis of Tongguang
                                in comparison during 2023-2025                                                                                   in comparison during 2023-2025

                                              sales revenues˄18% weight˅                                                                                        sales revenues˄18% weight˅

The average growth rate of net profits for                                net assets˄13% weight˅           The average growth rate of net profits for                                     net assets˄13% weight˅
   the last three years˄15% weight˅                                                                           the last three years˄15% weight˅                           


The average growth rate of                                                        net profits                 The average growth rate of                                                                   net profits
sales revenues for the last                                                       ˄13% weight˅                sales revenues for the last                                                                  ˄13% weight˅
three years˄14% weight˅                                                                                      three years˄14% weight˅                              

The ratio of international                                                          return on total assets              The ratio of international                                                         return on total assets
 revenues to total sales                                                               ˄8% weight˅                       revenues to total sales                                                              ˄8% weight˅
revenues˄6% weight˅                                                                                                     revenues˄6% weight˅
                                                                          return on net assets                                                                                 Tongguangret˄urn8%onwneeigt hats˅sets
      figures of 2023         sales revenues                                 ˄8% weight˅                                    figures of 2023       sales revenues
      figures of 2024                                                                                                       figures of 2024
                                                                                                                            figures of 2025contribution per employee
      figures of 2025 contribution per employee           SDGI                                                                                    ˄5% weight˅
                              ˄5% weight˅

Ⅳ Analysis of Strength and Weakness of the Top 10 Competitiveness Enterprises in Competitiveness Index

                      Table 7-2 The analysis of the strength and weakness index among the enterprises in the optical fiber and cable field of China

Company                       Ranking    Sales      Net assets     Net profits  Return on     Return on   Sales revenues            The ratio of          The average growth rate           The average growth rate
 YOFC                                  revenues                                 total assets  net assets  contribution per   international revenue        of sales revenues for the            of net profits for the
                                                                                                                            to total sales revenues                                               last three years
                                  ĭ                įį                               į             į          employee                                          last three years
                                                                                                                                          į                                                                 į
                                                                                                                   į                                                      į

HTGD                              ĭ                įĭ                               į        į                  į                  į                                   į                             į

      ZTT                         ĭ                ĭĭ                               į        į                  į                  į                                   į                             ĭ

FiberHome                         ĭ                ĭĭ                               į        į                  į                  į                                   į                             ĭ

TONGDING                          ĭ                ĭį                               į        į                  ĭ                  į                                   į                             ĭ

ETERN                             ĭ                ĭĭ                               ĭ        ĭ                  ĭ                  ĭ                                   į                             ĭ

      SDGI                        ĭ                ĭĭ                               į        į                  ĭ                  ĭ                                   į                             į

Tongguang                         į                ĭĭ                               ĭ        ĭ                  ĭ                  ĭ                                   į                             ĭ

FUTONG                            ĭ                įĭ                               ĭ        ĭ                  ĭ                  ĭ                                   į                             į

Nanfang                            į              ĭį                               ĭ        ĭ                  į                  ĭ                                   į                             į

    Note 5:The explanations of the strength and weakness index system refer to Note 6, Page 31

      【For more details of status analysis of the related enterprises, please refer to The competitiveness report on the Top 10 competitiveness enterprises
in the optical communications industry of China & Global market in 2025 (19th) (Integrated Edition)" 】

Chapter 8 Competitiveness Analysis of the Top 10 Competitiveness Enterprises in the
Optical Transmission and Network Access Equipment Field of China in 2025

Ⅰ Analysis of Financial Data

                      Table8-1 The standard value weighted of financial data of the Top 10 competitiveness enterprises in the optical
                                                            transmission and network access equipment field of China in 2025

                                                                                                                        The weighted standard value indexs of financial data

                                                                          Scale sub-factors˄weight 44%˅                     Efficiency sub-factors˄weight 27%˅                              Increase sub-factors˄weight 29%˅

                                                    Total                                                                                                                                   The The

                      Ranking of  Ranking of        standard                                                                            Sales     The ratio of                 Ranking of   average average
                                                                                                                                     revenues                                   standard
                      comprehensive financial data  value          Sales        Net   Net     Total Ranking of Return       Return  contribution  international Total                       growth rate growth rate        Total    Ranking of
                                                                                     profits                                on net                                                 value                                standard     standard
Company               competitiveness competitiveness weighted of  revenues assets            standard standard on total    assets        per     revenue standard              weighted    of sales  of net
                                                                                     weight                                          employee                                                                              value        value
                       index           index        the                               13%     value       value assets      weight                to total sales value               of     revenues profits            weighted     weighted
                                                                                                                              8%      weight                                    efficiency                             of increase  of increase
                                                    financial                                 weighted weighted                                   revenues weighted                         for the last for the last
                                                                                                                                                                                   index                                   index        index
                                                    data                                      of scale of scale                                                 of efficiency               three years three years

                                                                   weight weight              index       index weight                            weight        index                       weight    weight
                                                                                                                                                                                             14%       15%
                                                                   18%    13%                                       8%              5% 6%

HUAWEI                 1               1            4.9230         2.0952 2.5088 0.1601 4.7641            1 0.0005 0.0008 0.0751 0.0136 0.0900                                 2            0.0021    0.0668           0.0689       3

ZTE 2                                  2            2.3794         0.9705 1.3466 0.0184 2.3355            2 0.0004 0.0009 0.0249 0.0098 0.0360                                 4            -0.0005   0.0084           0.0079       4

FiberHome              3               3            1.2010         0.7530 0.2535 -0.0008 1.0057           3 0.0000 0.0003 0.0322 0.0134 0.0458                                 3            -0.0006   0.1500           0.1494       2

CIG 4                                  4            0.4986         0.2091 0.0373 -0.0022 0.2442           4 0.0002 0.0004 0.0501 0.0520 0.1027                                 1            0.0017    0.1500           0.1517       1

TIANYI                 5               5            -0.0289 0.0879 0.0348 -0.0027 0.1200                  5      -0.0001 0.0000 0.0076            -0.0024       0.0052         8            -0.0042   -0.1500 -0.1542               6

RAISECOM               6               6            -0.0605 0.0631 0.0245 -0.0029 0.0847                  6 -0.0010 -0.0008 0.0059 0.0053 0.0093                               6            -0.0045   -0.1500 -0.1545               7

SDGI                   7               7            -0.1006 0.0126 0.0218 -0.0016 0.0328                  7 -0.0012 -0.0016 0.0173 0.0041 0.0186                               5            -0.0019   -0.1500 -0.1519               5

GW Delight             8               8            -0.1531 -0.0030 0.0035 -0.0027 -0.0021                8      -0.0009 -0.0006 0.0124           -0.0036       0.0074         7            -0.0083   -0.1500 -0.1583               9

Huahuan                9               9            -0.1726 -0.0115 -0.0024 -0.0026 -0.0165               11 -0.0007 -0.0005 0.0003 -0.0004 -0.0013                            9            -0.0048   -0.1500 -0.1548               8

             Chuling   10              10           -0.1763 -0.0096 0.0043 -0.0027 -0.0079                9      -0.0015 -0.0011 -0.0052          -0.0021       -0.0100        11           -0.0084   -0.1500 -0.1584               10

30
   27   28   29   30   31   32   33   34   35   36   37