Page 30 - Market Analysis Report of Optical Communications Field in China & Global market 2025
P. 30

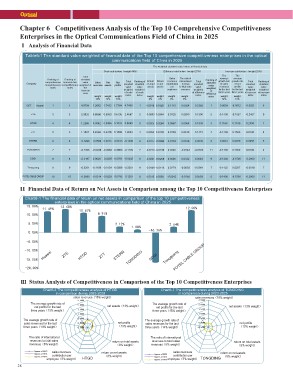
Chapter 6 Competitiveness Analysis of the Top 10 Comprehensive Competitiveness
Enterprises in the Optical Communications Field of China in 2025

Ⅰ Analysis of Financial Data

    Table6-1 The standard value weighted of financial data of the Top 10 comprehensive competitiveness enterprises in the optical
                                                                     communications field of China in 2025

                                                                                                                           The weighted standard value indexs of financial data

                                                                                   Scale sub-factors˄weight 44%˅                             Efficiency sub-factors˄weight 27%˅                     Increase sub-factors˄weight 29%˅

                                                              Total                                                                                                                                 The The

                       Ranking of  Ranking of standard                                                                                           Sales     The ratio of                 Ranking of    average       average
                                                                                                                                              revenues                                   standard   growth rate   growth rate
    Company            comprehensive financial data value                  Sales     Net    Net     Total Ranking of Return     Return       contribution  international Total                                                      Total    Ranking of
                                                                         revenues  assets  profits                              on net                                                     value      of sales       of net      standard     standard
                       competitiveness competitiveness weighted of                                  standard standard on total  assets            per      revenue standard              weighted    revenues        profits
                                                                          weight   weight  weight                                             employee                                              for the last  for the last     value        value
                       index       index                      the           18%     13%     13%     value  value assets         weight                     to total sales value               of    three years   three years    weighted     weighted
                                                                                                                                  8%           weight                                   efficiency                              of increase  of increase
                                                              financial                             weighted weighted                                      revenues weighted                           weight        weight
                                                                                                                                                                                           index                                   index        index
                                                              data                                  of scale of scale                                                    of efficiency

                                                                                                    index  index weight                                    weight        index

                                                                                                                       8%                          5% 6%                                            14%           15%

    CICT Huawei            1       1                          4.9799 1.2662 1.7412 1.7364 4.7438                  1 0.0019 0.0325 0.1115 0.0924 0.2382                                  1 -0.0009 -0.0012 -0.0021                            6

    ZTE                    3       3                          2.3625 0.8998 0.9553 0.6136 2.4687                  3 -0.0003 0.0384 0.0325 0.0690 0.1396                                 5 -0.1400 -0.1057 -0.2457                            9

    HTGD                   4       4                          1.2266 0.3042 0.3494 0.1533 0.8069                  5 0.0025 0.0284 0.0967 0.0564 0.1839                                  3 0.1169 0.1189 0.2358                               1

    ZTT                    5       5                          1.1607 0.4062 0.4378 0.1593 1.0033                  4 0.0054 0.0199 0.0793 0.0428 0.1473                                  4 -0.1400 0.1500 0.0100                              3

    ETERN                  6       6                          -0.1296 -0.0590 0.0013 -0.0813 -0.1390 9 -0.0177 -0.0094 0.0139 0.0168 0.0036                                             8 -0.0012 0.0070 0.0058                              5

    TONGDING               7       7                          -0.1305 -0.0238 -0.0062 -0.0800 -0.1100 7 -0.0213 -0.0196 0.0246 -0.0143 -0.0305 11 -0.1400 0.1500 0.0100                                                                      3

    SDGI                   8       8                          -0.3197 0.0620 -0.0205 -0.0761 -0.0345 6 -0.0221 -0.0268 0.0205 0.0332 0.0049                                             9 -0.1400 -0.1500 -0.2900                            11

    Tongguang              9       9                          -0.3201 -0.1199 -0.0104 -0.0898 -0.2201 11 -0.0149 -0.0118 0.0279 -0.0093 -0.0081 7 -0.1125 0.0207 -0.0919                                                                     7

    POTEL CABLE GROUP  10          10                         -0.3680 -0.0314 -0.0228 -0.0742 -0.1283 8 0.0315 0.0350 -0.0012 -0.0150 0.0503                                            6 -0.1400 -0.1500 -0.2900                            11

Ⅱ Financial Data of Return on Net Assets in Comparison among the Top 10 Competitiveness Enterprises

    Chart6-1 The financial data of return on net assets in comparison of the top 10 competitiveness
                              enterprises in the optical communications field of China in 2025


            Huawei          ZTE HTGD                              ZTT               ETERN TONGDING              SDGI TongguaPnOgTEL CABLE GROUP


Ⅲ Status Analysis of Competitiveness in Comparison of the Top 10 Competitiveness Enterprises

                   Chart6-4 The competitiveness analysis of HTGD                                                                         Chart6-7 The competitiveness analysis of TONGDING
                              in comparison during 2023-2025                                                                                            in comparison during 2023-2025

                                           sales revenues˄18% weight˅                                                                                                    sales revenues˄18% weight˅


    The average growth rate of                                               net assets˄13% weight˅                  The average growth rate of                                              net assets˄13% weight˅
       net profits for the last                                                                                         net profits for the last                   
                                                                                                                                                                         
    three years˄15% weight˅                                                                                                three years˄15% weight˅


    The average growth rate of                                                       net profits                 The average growth rate of                                                           net profits
    sales revenues for the last                                                      ˄13% weight˅                sales revenues for the last                                                          ˄13% weight˅
    three years˄14% weight˅                                                                                     three years˄14% weight˅                           

    The ratio of international                                                     return on total assets              The ratio of international                                                                 return on total assets
     revenues to total sales                                                           ˄8% weight˅                      revenues to total sales                                                                      ˄8% weight˅
    revenues˄6% weight˅                                                                                                revenues˄6% weight˅
                                                                         return on net assets
    figures of 2023 sales revenues                                          ˄8% weight˅                                                            sales revenues                            return on net assets
    figures    of  22002254empclooyneterib˄u5ti%onwpeeirght˅                                                                    figures  of  2023
    figures    of                                             HTGD                                                              figures  of  2024       contribution per  TONGDING ˄8% weight˅
                                                                                                                                figures  of  2025  employee˄5% weight˅

28
   25   26   27   28   29   30   31   32   33   34   35