Page 23 - Market Analysis Report of Optical Communications Field in China & Global market 2025
P. 23

Chapter 3 Competitiveness Analysis of the Top 10 Competitiveness Enterprises in
the Optical Fiber and Cable Field of Global Market in 2025

Ⅰ Analysis of Financial Data

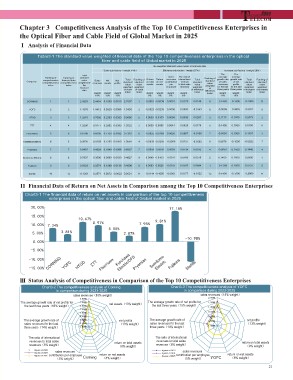
          Table3-1 The standard value weighted of financial data of the Top 10 competitiveness enterprises in the optical
                                                               fiber and cable field of Global market in 2025

                                                                                                                     The weighted standard value indexs of financial data

                                                                           Scale sub-factors(weight 44%)                  Efficiency sub-factors(weight 27%)                              Increase sub-factors(weight 29%)

                                                         Total                                                                                                                            The The

                           Ranking of   Ranking of       standard                                                                     Sales     The ratio of                 Ranking of   average average
                                                                                                                                   revenues                                   standard
                           comprehensive financial data  value      Sales  Net        Net     Total Ranking of Return     Return  contribution  international Total                       growth rate growth rate        Total    Ranking of
                                                                                     profits                              on net                                                 value                                standard     standard
Company                competitiveness competitiveness weighted of  revenues assets           standard standard on total  assets        per     revenue standard              weighted    of sales  of net
                                                                                     weight                                        employee                                                                              value        value
                                 index  index               the                       13%     value  value assets         weight                to total sales value               of     revenues profits            weighted     weighted
                                                                                                                             8%     weight                                    efficiency                             of increase  of increase
                                                         financial                            weighted weighted                                 revenues weighted                         for the last for the last
                                                                                                                                                                                 index                                   index        index
                                                         data                                 of scale of scale                                               of efficiency               three years three years

                                                                    weight weight             index  index weight                               weight        index                       weight    weight
                                                                                                                                                                                           14%       15%
                                                                    18%    13%                                   8%                5% 6%

CORNING                          1      1                2.4253 2.4454 0.1939 0.0613 2.7007               1 -0.0001 -0.0038 0.0010 0.0175 0.0146                             6 -0.1400 -0.1500 -0.2900 11

YOFC                             2      2                1.4375 1.4412 0.0929 0.0088 1.5430               2 -0.0023 -0.0239 0.0036 0.0083 -0.0143                            8            -0.0009 -0.0903 -0.0911                 8

HTGD                             3      3                1.2815 0.7080 0.2393 0.0383 0.9856               5 0.0039 0.0153 0.0056 0.0039 0.0287                               3            0.1173 0.1500 0.2673                    2

ZTT                              4      4                1.2800 0.9177 0.2952 0.0393 1.2522               3 0.0050 0.0055 0.0044 0.0028 0.0178                               5 -0.1400 0.1500 0.0100                              6

FiberHome                        5      6                0.8708 0.6095 0.1130 0.0092 0.7318               6 -0.0025 -0.0169 0.0020 0.0067 -0.0106                            7            -0.0004 0.1500 0.1497                   3

Furukawa Electric/OFS            6      5                0.9526 0.9159 0.1355 0.0035 1.0550               4 -0.0039 -0.0293 -0.0006 0.0137 -0.0202                           9            0.0678 -0.1500 -0.0822                  7

Prysmian                         7      7                0.8497 0.4824 0.1948 0.0096 0.6867               7 -0.0009 -0.0003 0.0059 0.0134 0.0182                             4 -0.0053 0.1500 0.1448                              4

Sumitomo Electric                8      8                0.7837 0.3590 0.0999 0.0039 0.4627               9 0.0049 0.0103 -0.0012 0.0169 0.0310                              2            0.1400 0.1500 0.2900                    1

Fujikura                         9      9                0.5933 0.3574 0.1288 0.0136 0.4998               8 0.0093 0.0525 -0.0011 0.0197 0.0804                              1 -0.1369 0.1500 0.0131                              5

Sterlite                         10     12               -0.1301 0.2571 0.0072 -0.0022 0.2621        11 -0.0114 -0.1085 -0.0001 0.0177 -0.1022                               12           -0.1400 -0.1500 -0.2900                 11

Ⅱ Financial Data of Return on Net Assets in Comparison among the Top 10 Competitiveness Enterprises

Chart3-1 The financial data of return on net assets in comparison of the top 10 competitiveness
                  enterprises in the optical fiber and cable field of Global market in 2025


                    CORNING YOFC                  HTGD       ZTT FiberHome FEurleucktarwica/OFSPrysmian   SumEitloemctoric  Fujikura             Sterlite


Ⅲ Status Analysis of Competitiveness in Comparison of the Top 10 Competitiveness Enterprises

                       Chart3-2 The competitiveness analysis of Corning                                                                Chart3-3 The competitiveness analysis of YOFC
                                   in comparison during 2023-2025                                                                                 in comparison during 2023-2025
                                                                                                                                                                  sales revenues˄18% weight˅
                                               sales revenues˄18% weight˅


The average growth rate of net profits for                           net assets˄13% weight˅                The average growth rate of net profits for                  
   the last three years˄15% weight˅                                                                           the last three years˄15% weight˅                         


The average growth rate of                                                     net profits                 The average growth rate of                                                                   net profits
sales revenues for the last                                                   ˄13% weight˅                sales revenues for the last                                                                         ˄13% weight˅
three years˄14% weight˅                                                                                   three years˄14% weight˅

The ratio of international                                                        return on total assets                  The ratio of international                                                             return on total assets
 revenues to total sales                                                              ˄8% weight˅                          revenues to total sales                                                                   ˄8% weight˅
revenues˄6% weight˅                                                                                                       revenues˄6% weight˅
                                                                     return on net assets                                                                                                           return on net assets
     figures of 2023                    sales revenues                  ˄8% weight˅                                       figures  of  2023        sales revenues                                      ˄8% weight˅
     figures of 2024                                                                                                      figures  of  2024  contribution per employee
                                 contribution per employee                                                                figures  of  2025                                                                                        21
     figures           of  2025        ˄5% weight˅          Corning                                                                                ˄5% weight˅               YOFC
   18   19   20   21   22   23   24   25   26   27   28