
Page 35 - Market Analysis Report of Optical Communications Field in China & Global market 2025
P. 35
Ⅳ Analysis of Strength and Weakness of the Top 10 Competitiveness Enterprises in Competitiveness Index
Table 9-2 The analysis of the strength and weakness index among the enterprises in the optical components and auxiliary equipment & raw material field of China
Company Ranking Sales Net assets Net profits Return on Return on Sales revenues The ratio of The average growth rate The average growth rate
Accelink revenues total assets net assets contribution per international revenue of sales revenues for the of net profits for the
to total sales revenues last three years
employee last three years
į
ĭ ĭ į į į ĭ į į
Zhongji Innolight ĭ ĭ į į į ĭ į ĭ ĭ
Eoptolink ĭ ĭ į į į į į ĭ ĭ
JONHON ĭ ĭ į į į ĭ į ĭ ĭ
HGTECH ĭ į į į į ĭ į į ĭ
TFC ĭ į į į į į į ĭ ĭ
T&S Communications ĭ į į į į į į ĭ ĭ
EverProX ĭ ĭ į į į ĭ į ĭ į
AFR ĭ ĭ ĭ ĭ ĭ ĭ ĭ į į
O-Net ĭ ĭ ĭ ĭ ĭ ĭ ĭ į į
Note7: The financial data of competitiveness is formed by 9 indicators of certain weight, and the strength and weakness indicators are different in each
company. We classify the 9 indicators into 2 sorts: one is higher than the competitiveness score of the company, that is, these indicators improve the
company's competitiveness, we call it the strength indicator; otherwise, it is weakness indicators. What the readers should be reminded is that we classify
the sorts by the standard value of fundamental data in companies' competitiveness but not the average score of the whole industry. For example, Prysmian's
standard value of the net assets is 0.6904, above the average value, and above the standard value of the company's competitiveness, thus we put it into
strength indicator. In the tables, the strength indicator is labeled by "↑", and weakness indicator by "↓". With the indicators divided into 2 sorts, the
enterprises can pay more attention to their weakness ones, which oriented their effort to improve the competitiveness. As for the order of the indicators to
draw attention, you can refer to the indicators of the corporators’ specific data to determine.
【For more details of status analysis of the related enterprises, please refer to The competitiveness report on 'The top 10 competitiveness enterprises
in the optical communications industry of China & Global market in 2025 (19th) (Integrated Edition)" 】
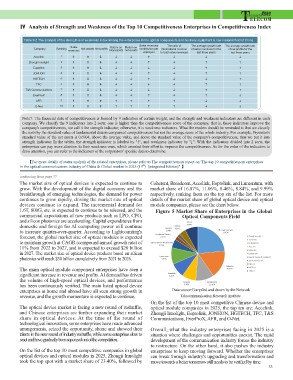
continuing from page 37 Coherent, Broadcom, Accelink, Eoptolink, and Lumentum, with
market share of 16.87%, 11.06%, 8.46%, 8.84%, and 9.99%
The market size of optical devices is expected to continue to respectively, ranking them on the top six of the list. For more
grow. With the development of the digital economy and the details of the market share of global optical device and optical
breakthrough of emerging technologies, the demand for power module companies, please see the chart below.
continues to grow rapidly, driving the market size of optical
devices continue to expand. The incremental demand for Figure 5 Market Share of Enterprises in the Global
1.6T, 800G, etc. is expected to continue to be released, and the Optical Components Field
commercial expectations of new products such as LPO, CPO,
and silicon photonics are accelerating. Capital expenditures from
domestic and foreign for AI computing power will continue
to increase quarter-over-quarter. According to Lightcounting's
forecast, the global market size of optical modules is expected
to maintain growth at CAGR (compound annual growth rate) of
11% from 2022 to 2027, and is expected to exceed $20 billion
in 2027. The market size of optical device products based on silicon
photonics will reach $30 billion cumulatively from 2021 to 2026.
The main optical module component enterprises have seen a Data source:Compiled and drawn by the Network
significant increase in revenue and profits. AI demand has driven Telecommunication Research Institute
the volume of high-speed optical devices, and performance
has been continuously verified. The main listed optical device On the list of the top 10 most competitive Chinese device and
enterprises at home and abroad have all seen strong growth in optical module companies in 2025, the top ten are: Accelink,
revenue, and the growth momentum is expected to continue. Zhongji Innolight, Eoptolink, JONHON, HGTECH, TFC, T&S
The optical device market is facing a new round of reshuffle, Communications, EverProX, AFR, and O-Net.
and Chinese enterprises are further expanding their market
share in optical devices. At the time of the round of Overall, what the industry enterprises facing in 2025 is a
technological innovation, some enterprises have made advanced situation where challenges and opportunities coexist. The rapid
arrangements, seized the opportunity, shone and showed their development of the communication industry forces the industry
talents in the new round of industry reshuffle, while some enterprises slow to to restructure. On the other hand, it also pushes the industry
reactandhavegraduallybeensqueezedoutofthecompetition. enterprises to keep moving forward. Whether the enterprises
On the list of the top 10 most competitive companies in global can break through industry's upgrading and transformation and
optical devices and optical modules in 2025, Zhongji Innolight move towards a better tomorrow still needs to be verifiedbytime.
took the top spot with a market share of 23.40%, followed by
33