English中文
  Ranking analysis       Competitiveness analysis       Market analysis


Preface • Work summary

Over the past year, factors such as 4G densification, upcoming 5G commercial, data centers, and the digitization of industrial connectivity have contributed to the development of the global optical communications market.


Undoubtedly, 5G is the most promising market promoter, bringing direct and indirect economic benefits to the social economy. The global 5G mobile infrastructure market is expected to grow from $50 million in 2019 to $2.3 billion by 2021.


The 5G large-scale commercial deployment is expected to see a significant increase in the total demand for optical modules and market size during the 5G era. It is expected that the total volume of 5G optical modules will be 1.64-4.2 times that of 4G, the 5G market scale will be 2.9-6.8 times of 4G's, and the demand of 5G optical fiber will be 16 times of 4G's. In the first half of 2018, the length of optical cables in China reached 40,238,864 km, an increase of 2,764,825 km or 7.37% over the end of last year, of which the length of long-distance cables reached 1,055,174 km, an increase of 13,786 km.

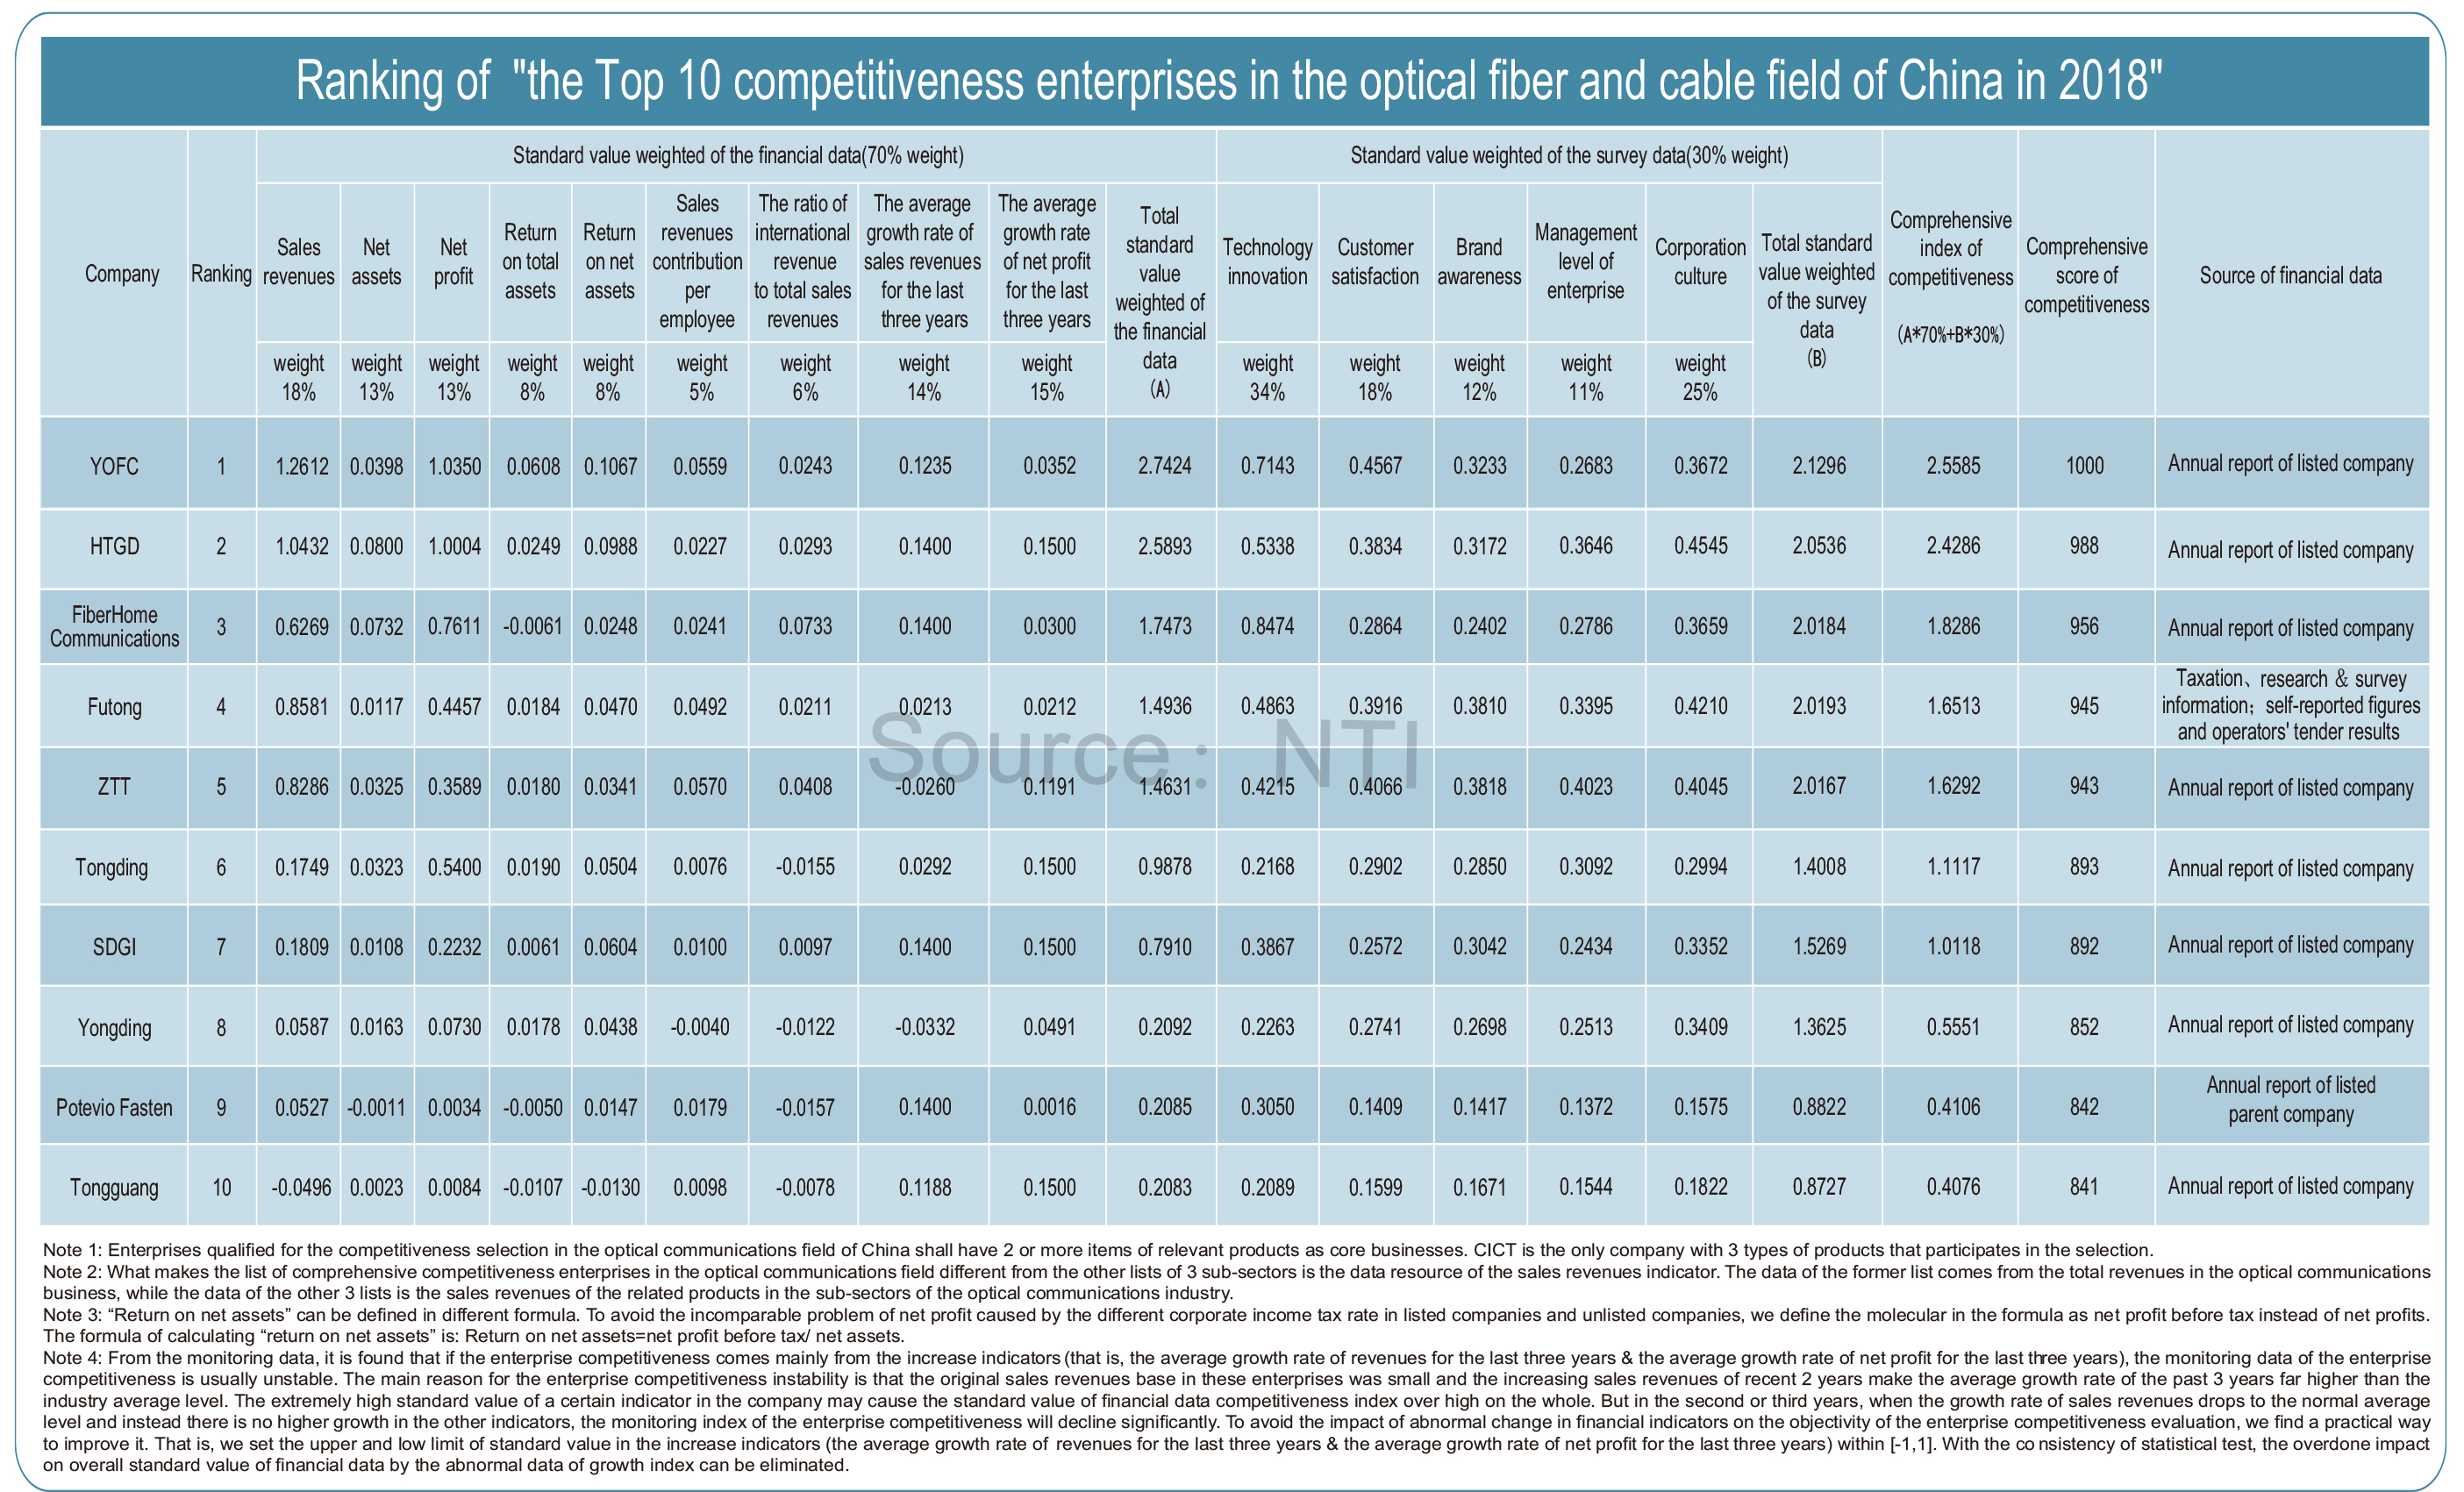
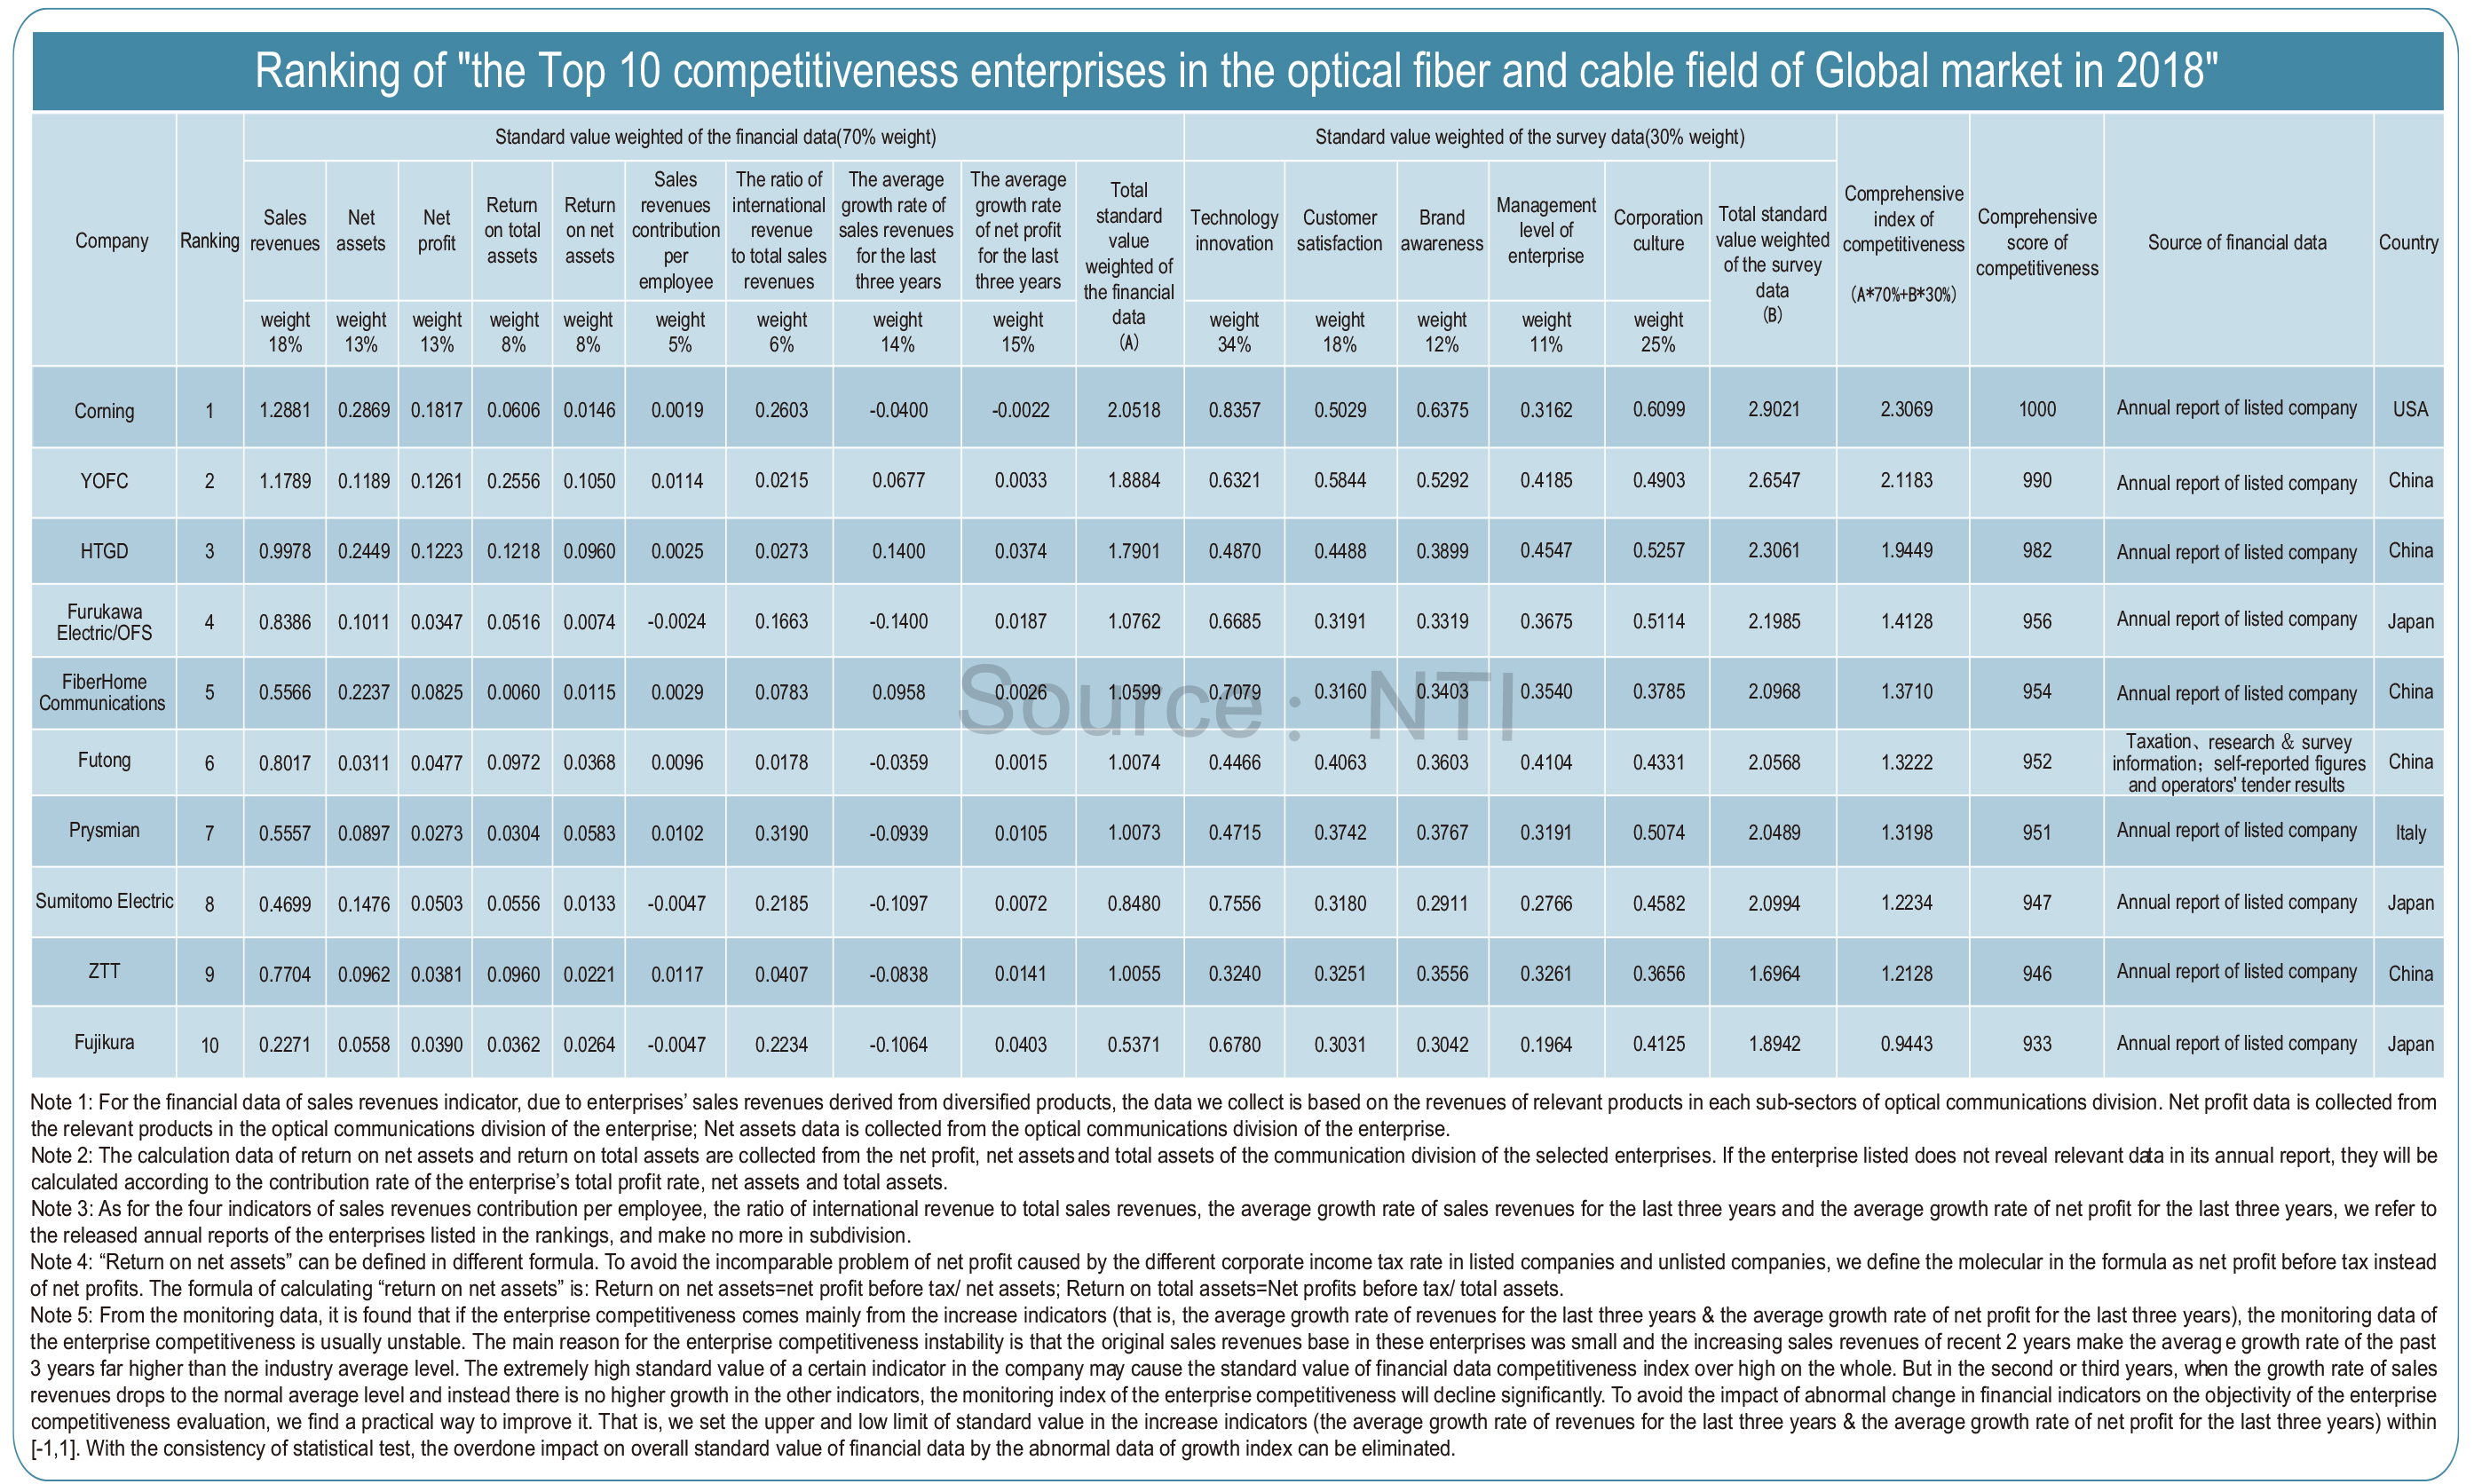
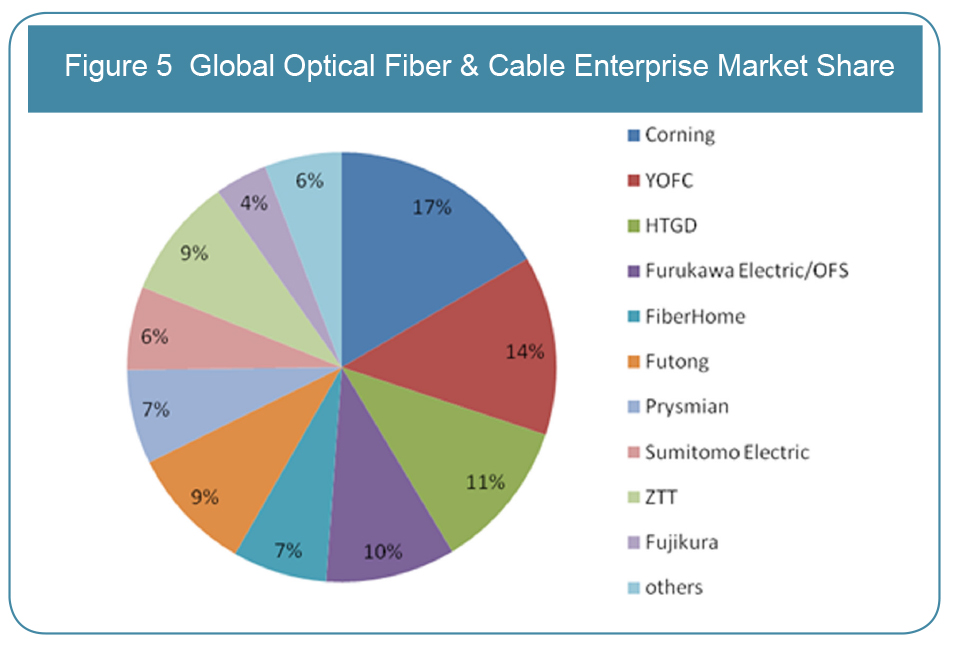
Network Telecom Information Research Institute has engaged in the competitiveness assessment of China/global optical fiber & cable enterprises for 12 years. “The Top 10 Competitiveness Enterprises in the Global Optical Fiber & Cable Field in 2018” clearly displays the competitive situations of main optical fiber & cable enterprises in 2018.

The research shows that companies in top 10 competitiveness enterprises of global fiber & cable market list are divided up by four countries, namely, the United States (Corning), Italy (Prysmian), Japan (Furukawa Electronic/OFS, Sumitomo Electric, Fujikura) and China (YOFC, HTGD, FiberHome, Futong, and ZTT), with Chinese enterprises occupying half of the list. That is, YOFC ranks second in the world with 14% market share, while HTGD ranks third with 11% market share. FiberHome, Futong, and ZTT respectively ranks fifth, sixth and ninth with market share of 7%, 9% and 9%. Corning, Furukawa Electric/ofs, Prysmian, Sumitomo Electric, Fujikura take up market share of 17%, 10%, 7%, 6% and 4% respectively. These 10 enterprises entirely take up 83% of global optic fiber and cable market share, showing strong market competitive advantage.

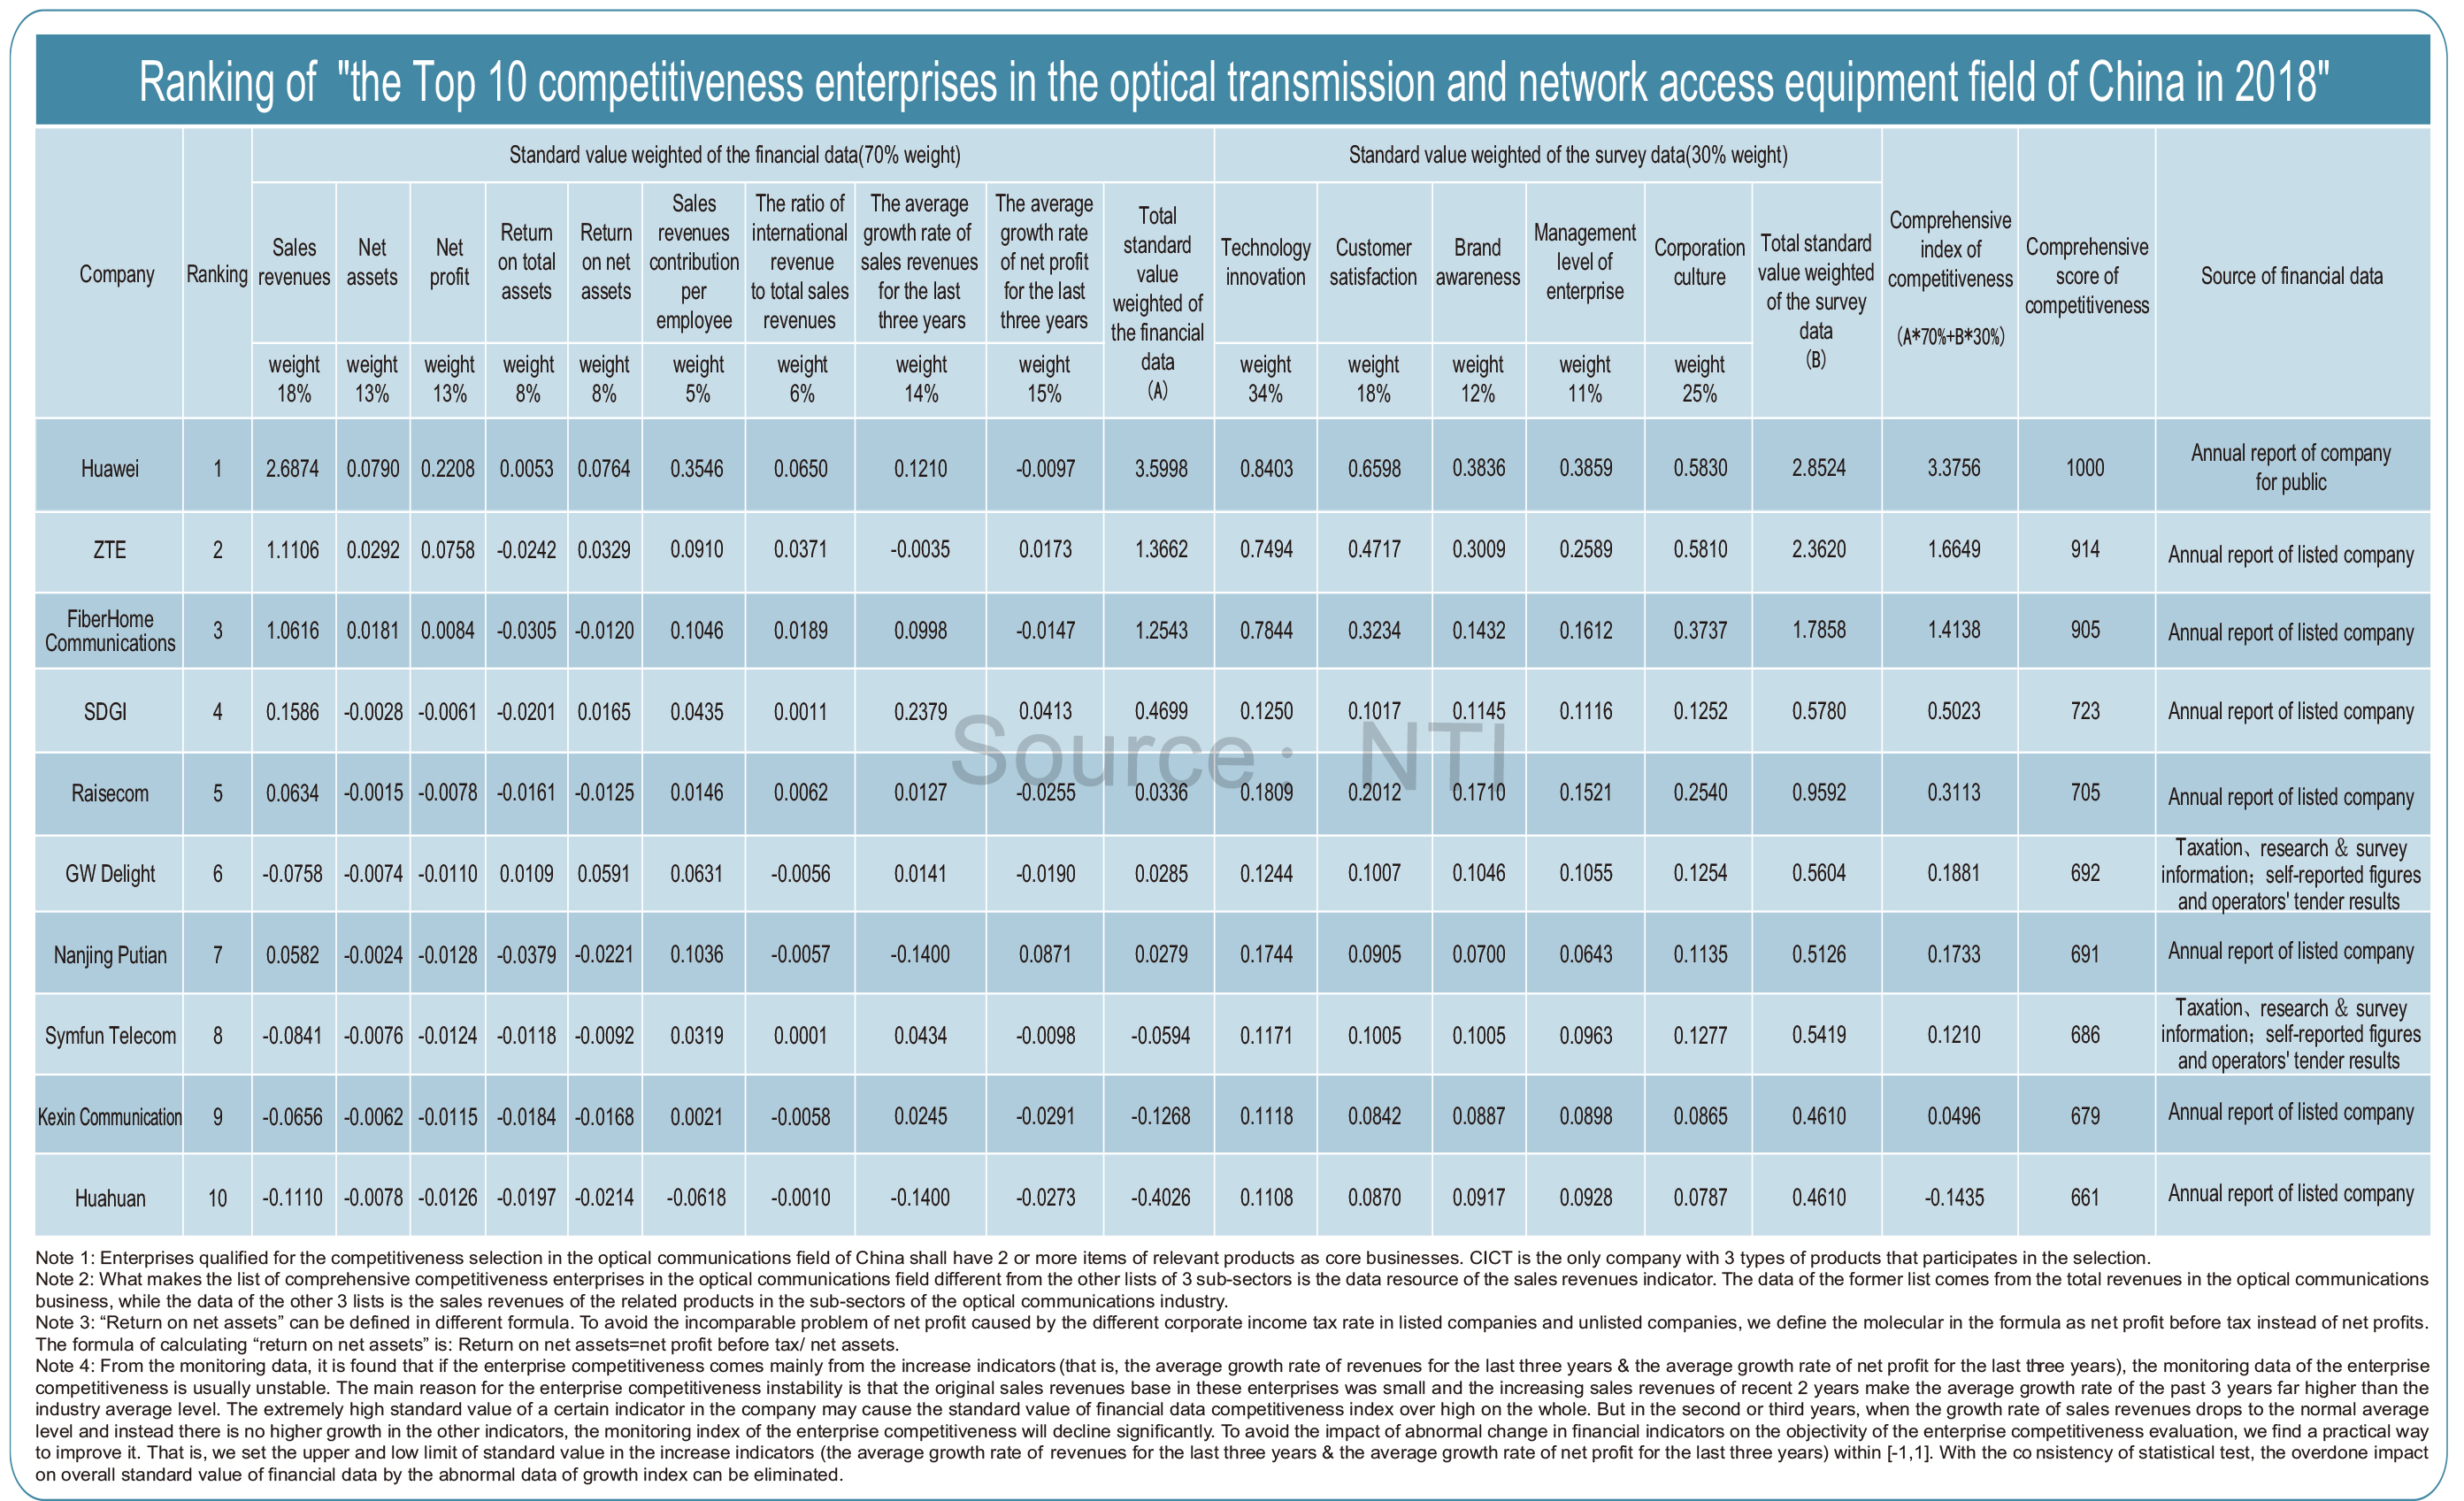
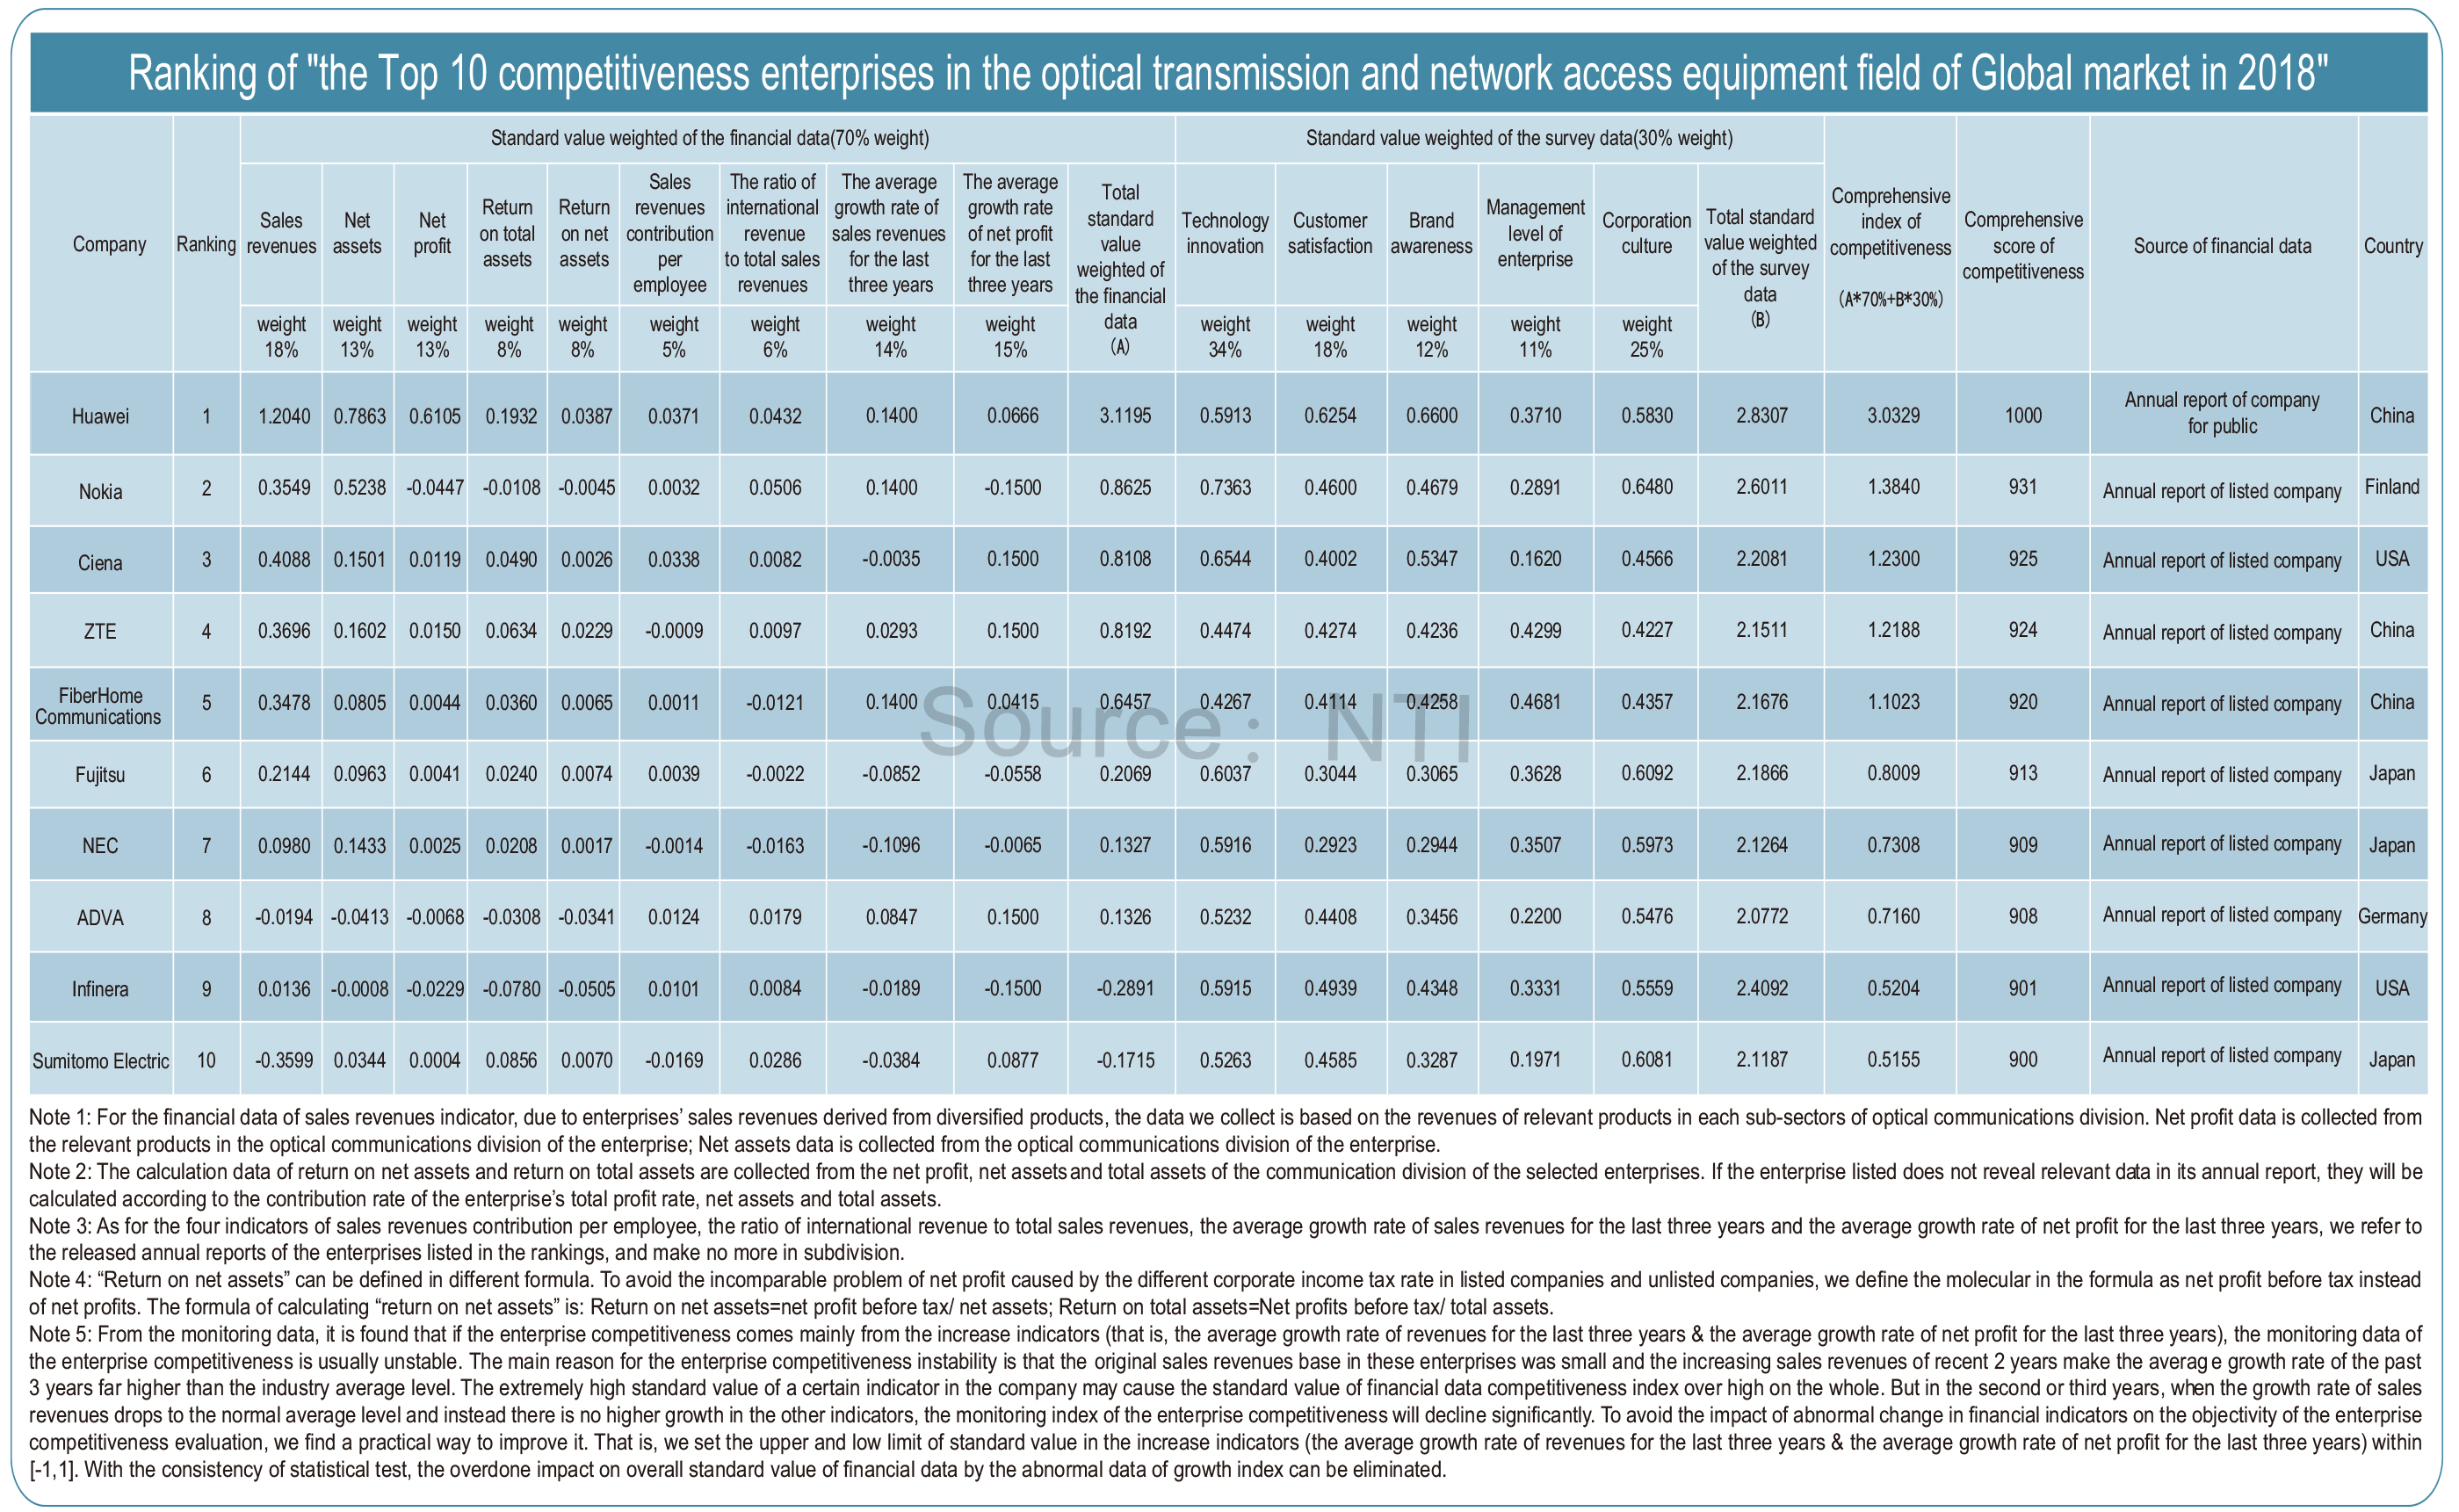
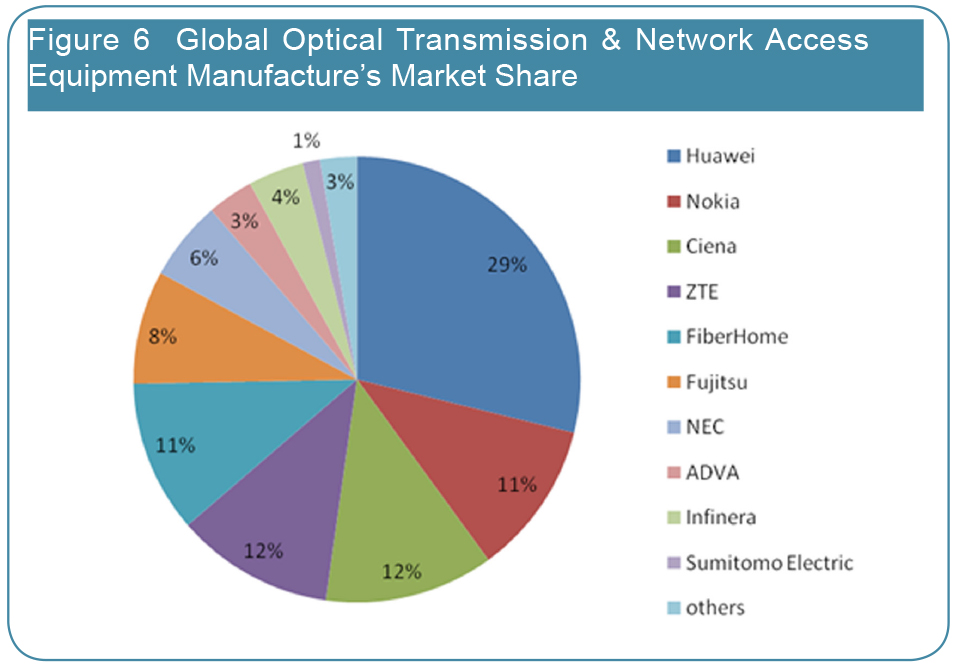
Viewing from the entire global optical transmission and network access equipment, HUAWEI stabilizes its leading position with competitiveness comprehensive score exceeding second Nokia of 69 points. Ten companies in this list come from five countries: Finland (Nokia), Japan (Fujitsu, NEC, Sumitomo Electric), the United States (Ciena, Infinera), China (Huawei, ZTE, FiberHome), and Germany's (ADVA). HUAWEI ranks first by sharing 29% of global optical transmission and network access equipment. Nokia locates number 2 with its 11% of market share. Ciena is listed number 3 with its 12% market share. ZTE is in number 4 location, with market share of 12%. And FiberHome is in number 5 location with its market share of 11%. Fujitsu, NEC, ADVANCE, Infinera, SUMITOMO ELECTRIC respectively take up 8%, 6%, 3%, 4% and 1% of market share. These 10 enterprises totally cover 97% of global optical transmission and network access equipment market share.

Optical network and transmission equipment is a sub-industry with high industrial centralization degree. In the last year, the five major equipment manufacturers’ revenue all realized positive growth. While on net profit aspect only Nokia showed loss situation. HUAWEI is the leader in this field, which has been listed 1st for many years, and is expanding its advantages.


With the multiple advantages of technology, cost and service, many major enterprises such as HUAWEI, ZTE developed rapidly. They kept leading domestic market and on the other way actively developing international market and seizing market share of abroad traditional old brand telecommunication equipment enterprises, becoming the backbone of global optical communication industry. It is understood that currently domestic optical network equipment enterprises’ optical transmission and optical access equipment has been massively used by operators in Europe, South East Asia and Africa etc. Chinese optical network equipment enterprises begin to become international important forces. It should be noted that domestic enterprises must strengthen innovation and legal awareness in the process of international expansion. The sanctions of ZTE by U.S. government and the full-scale trade war between China and the United States should serve as an important warning to the international expansion of various industries.


At the same time, optical network equipment industry begins entering into the stage of oligopolistic competition. With the competition becoming more and more fierce, market share will further concentrate on leading enterprises, while the surviving environment of small and medium-sized manufacturers will become worse.


Optical components are the most competitive sub-industry in optical communication industry chain, and the top 10 global suppliers take up 62% of market share.

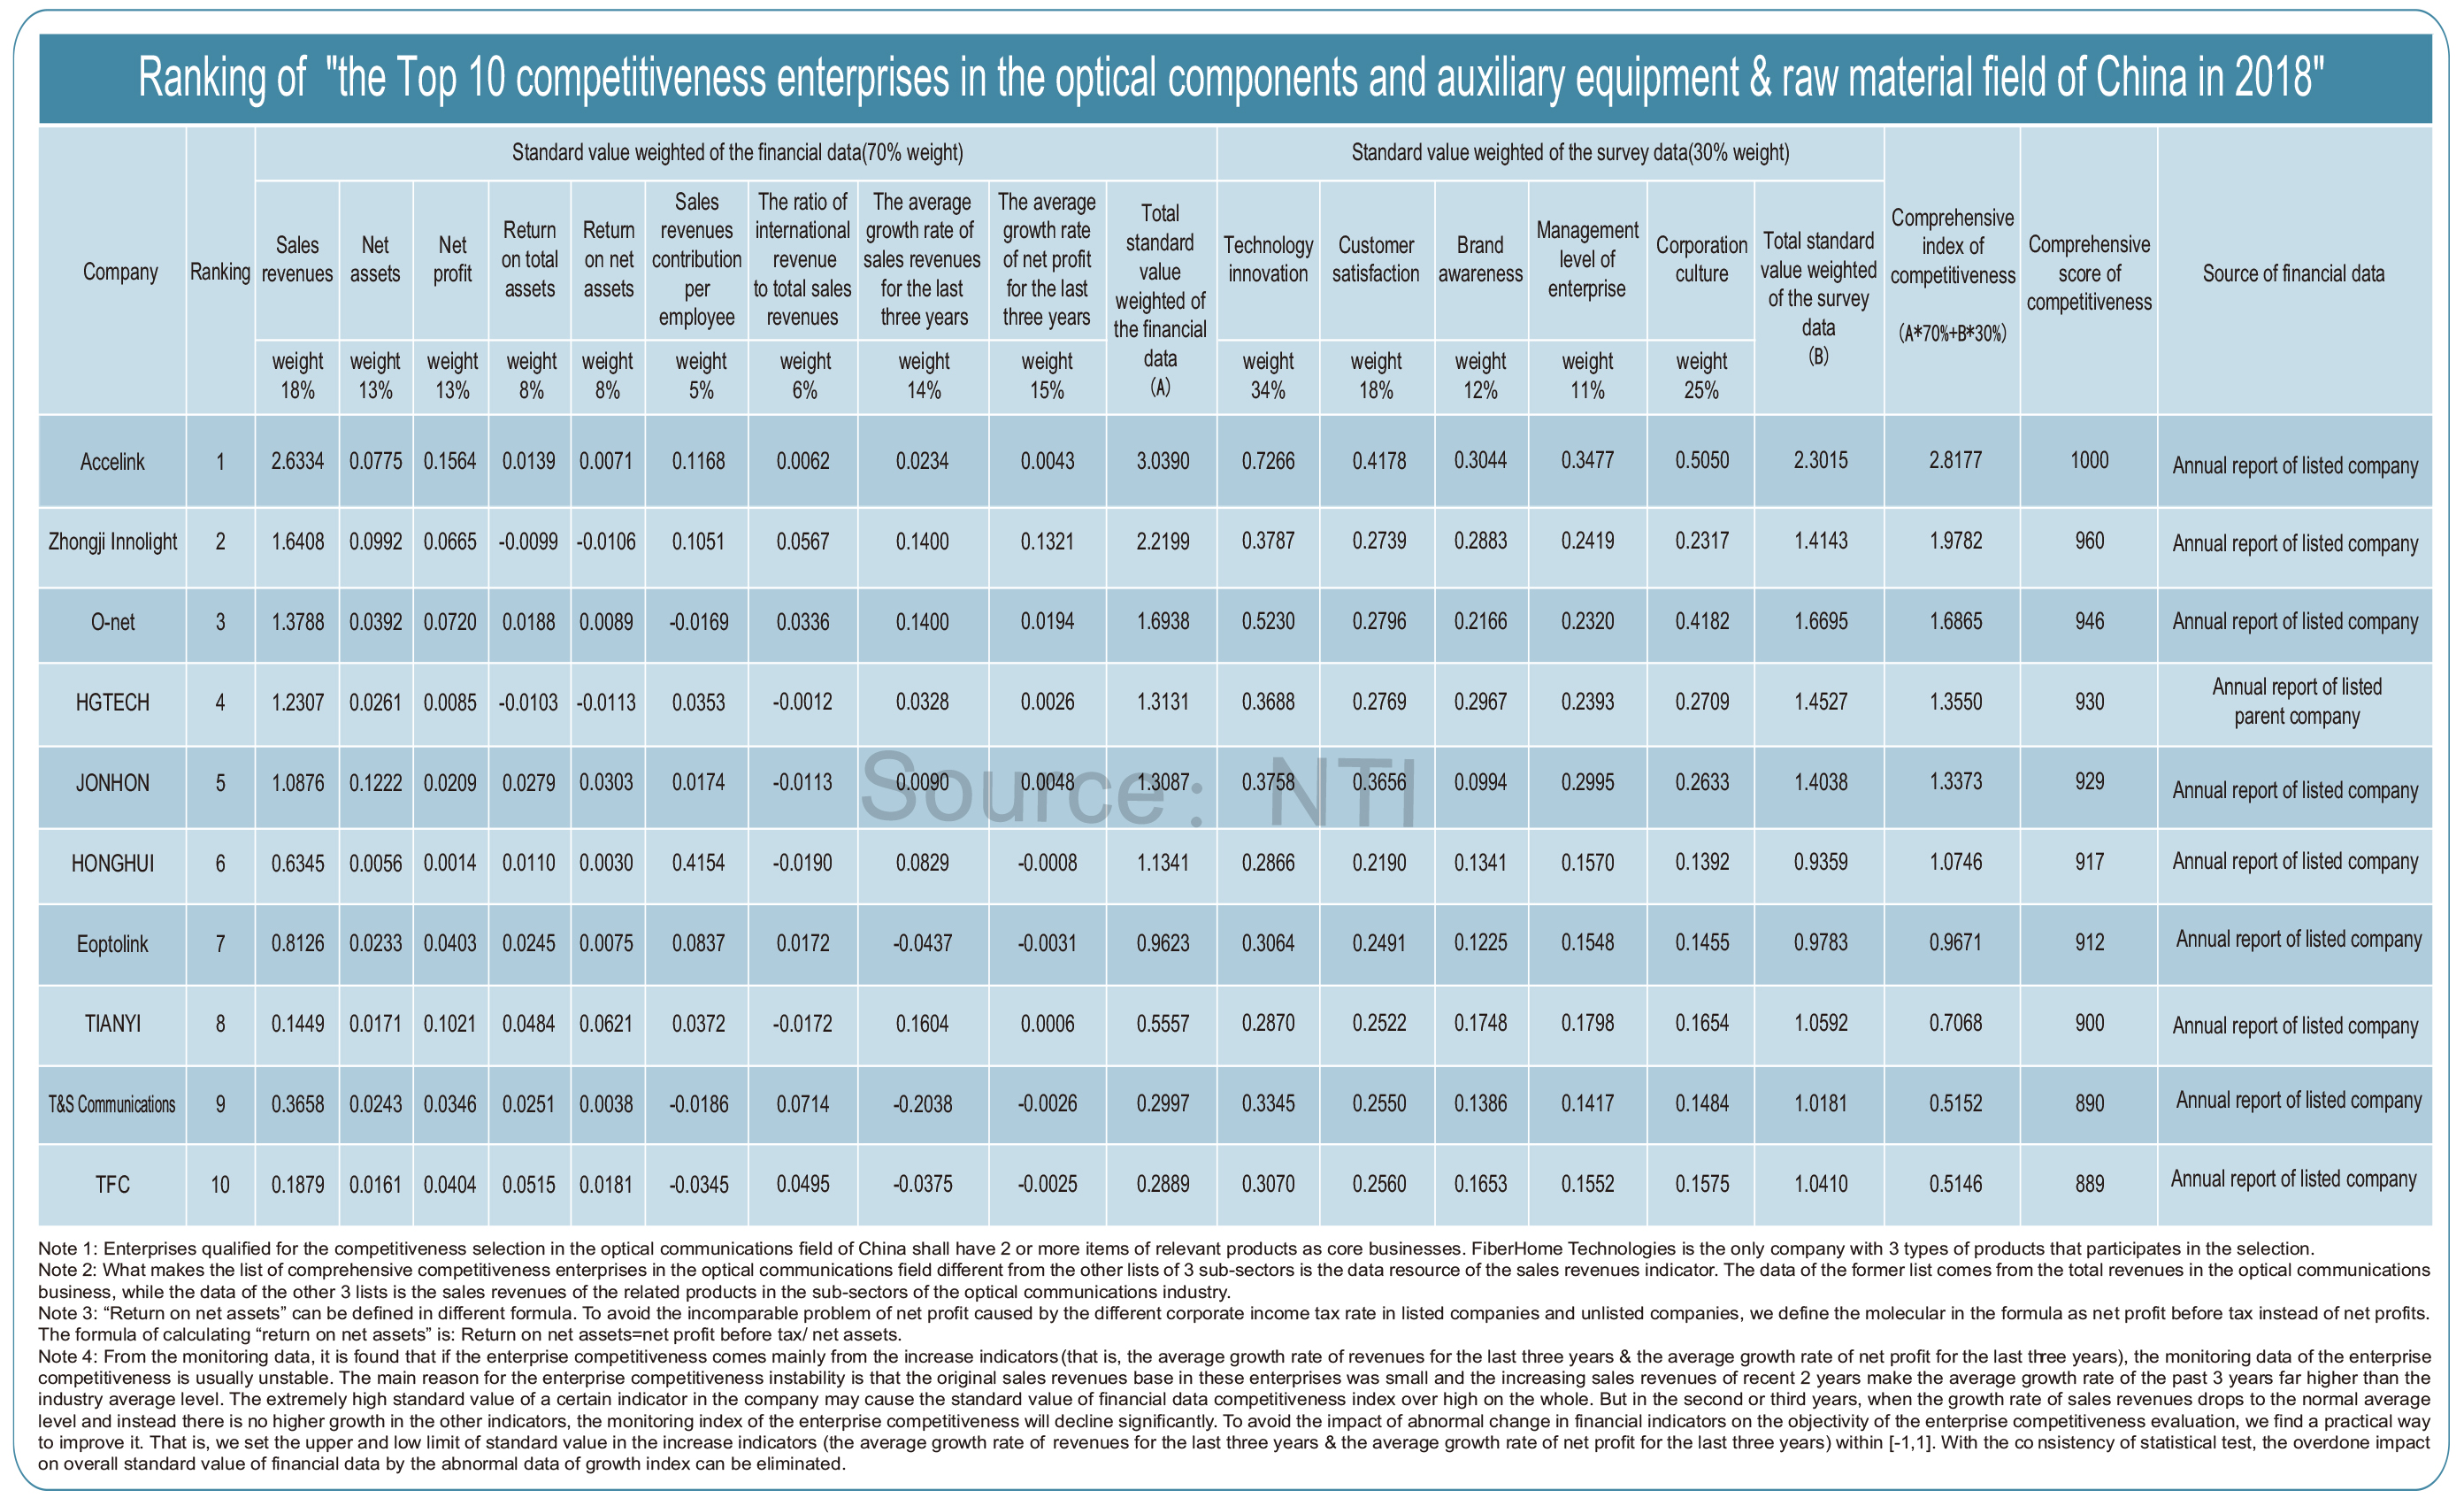
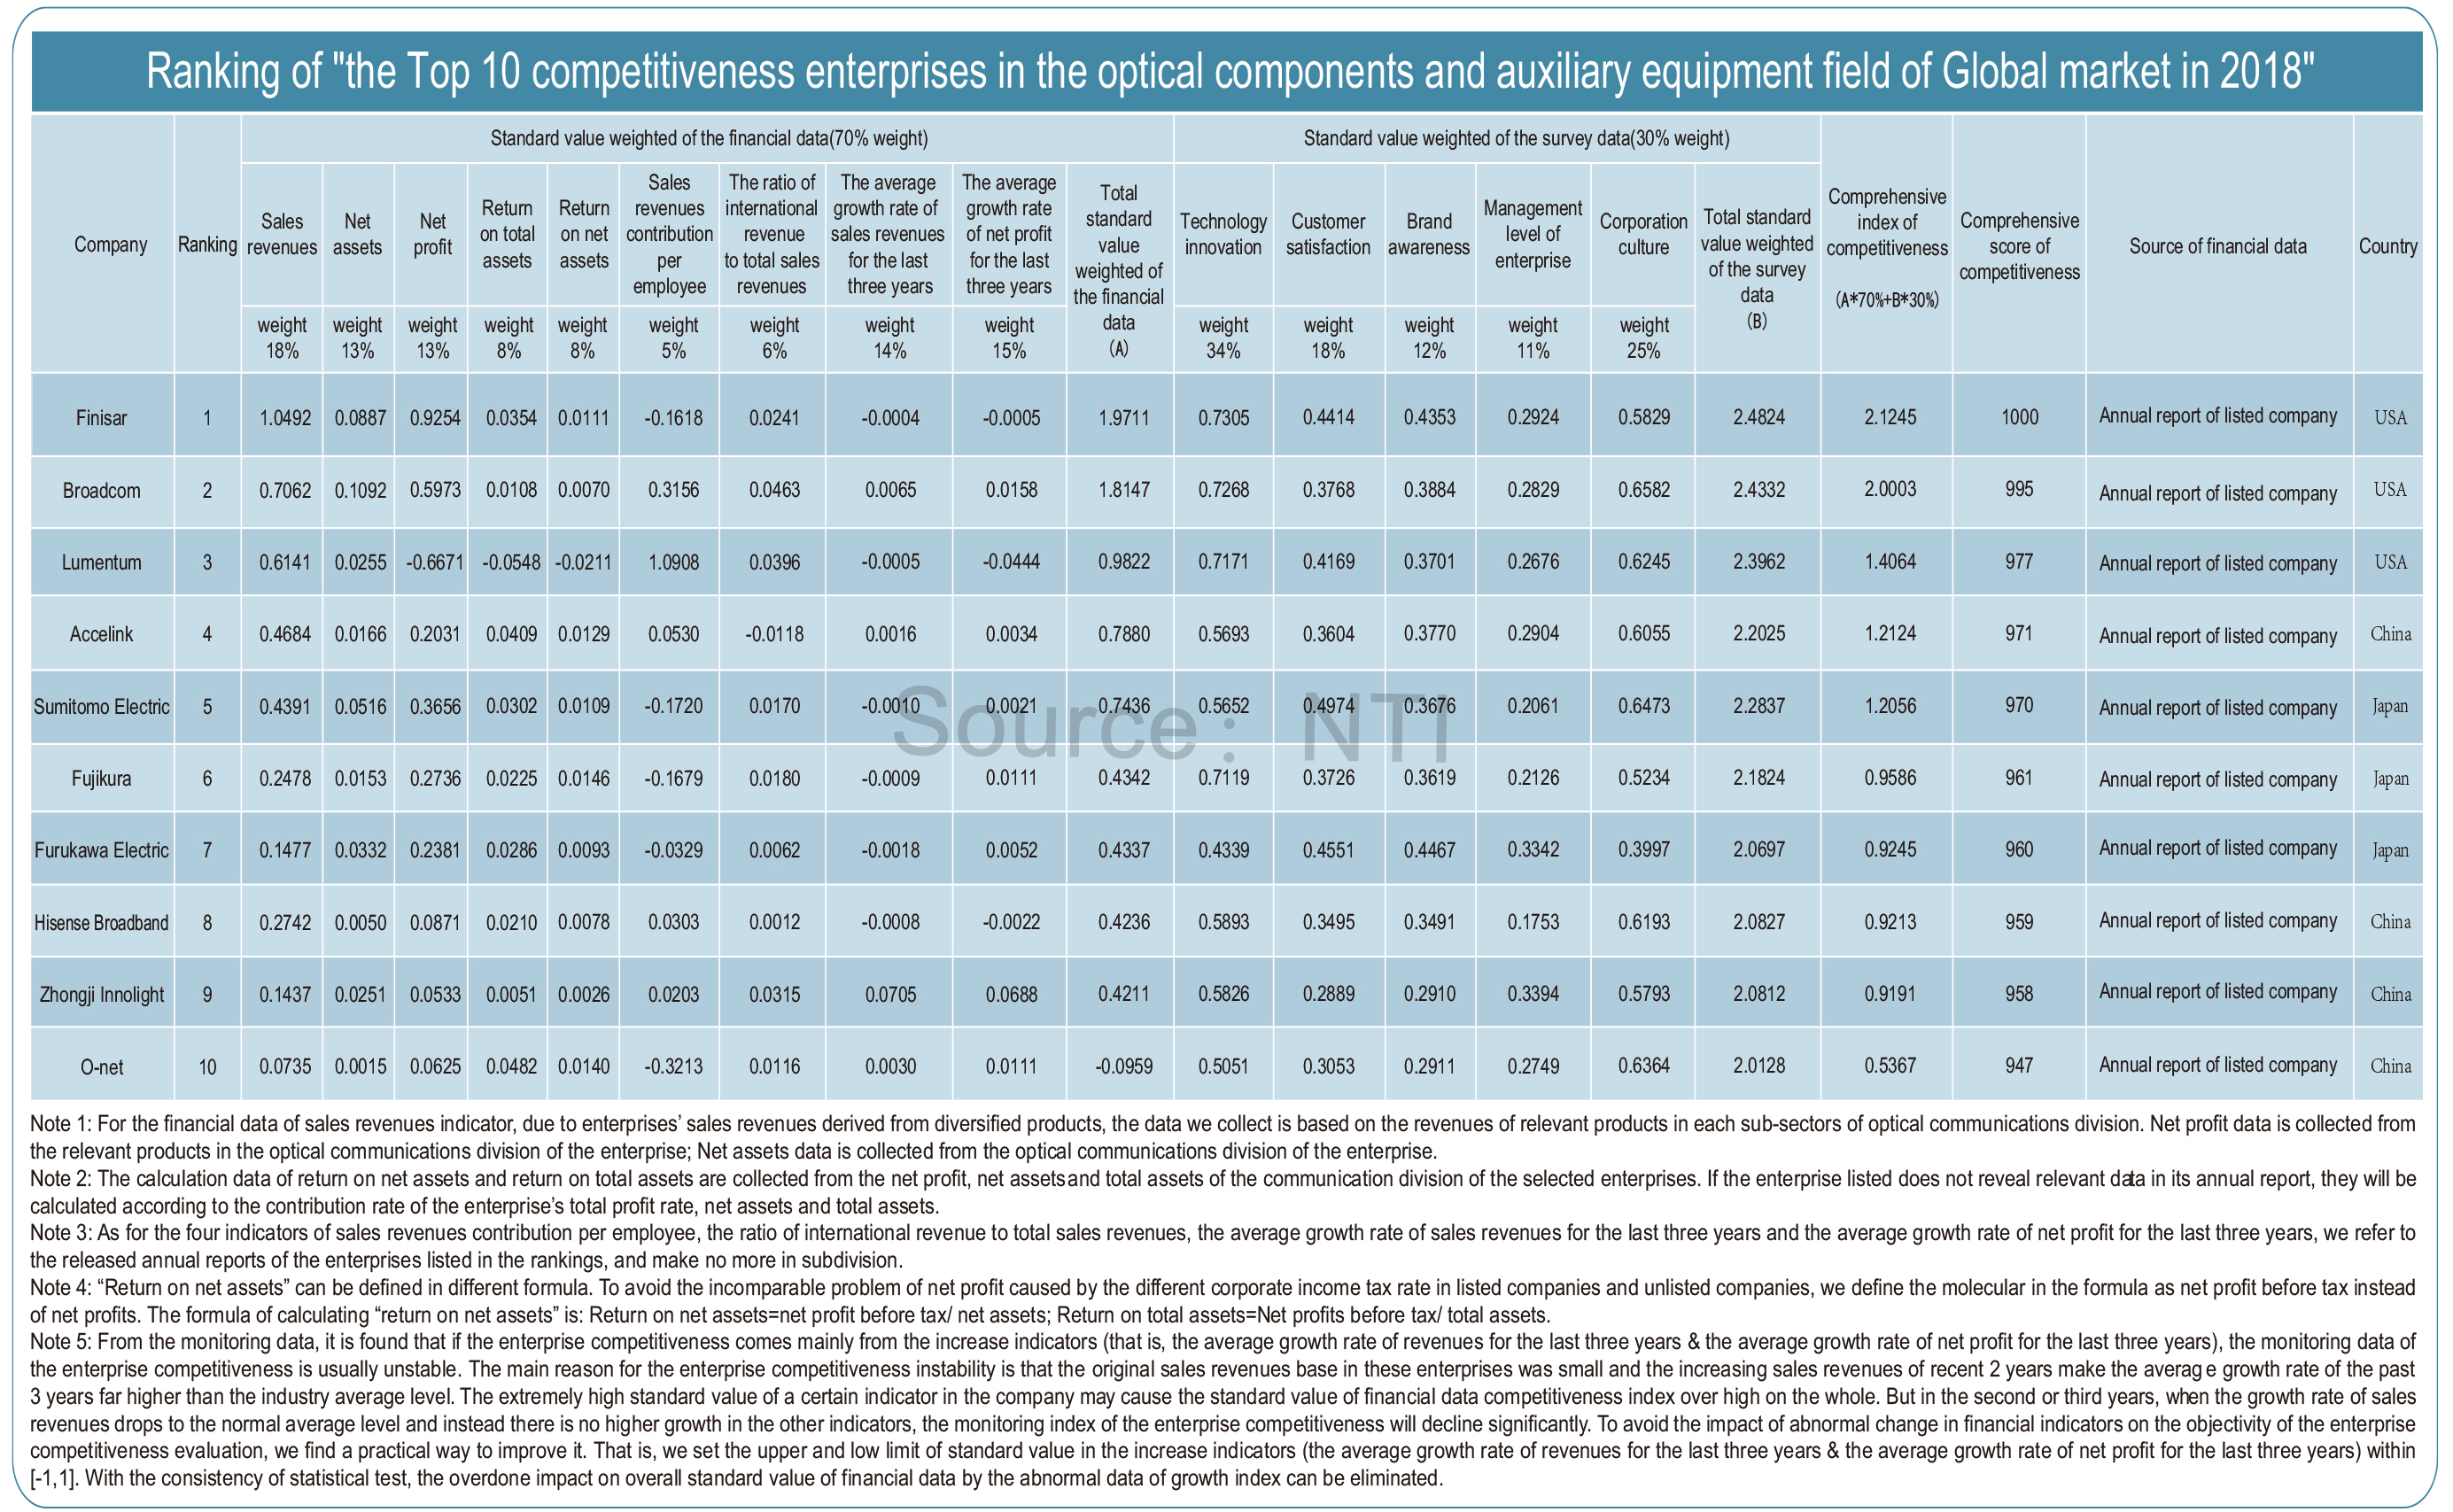
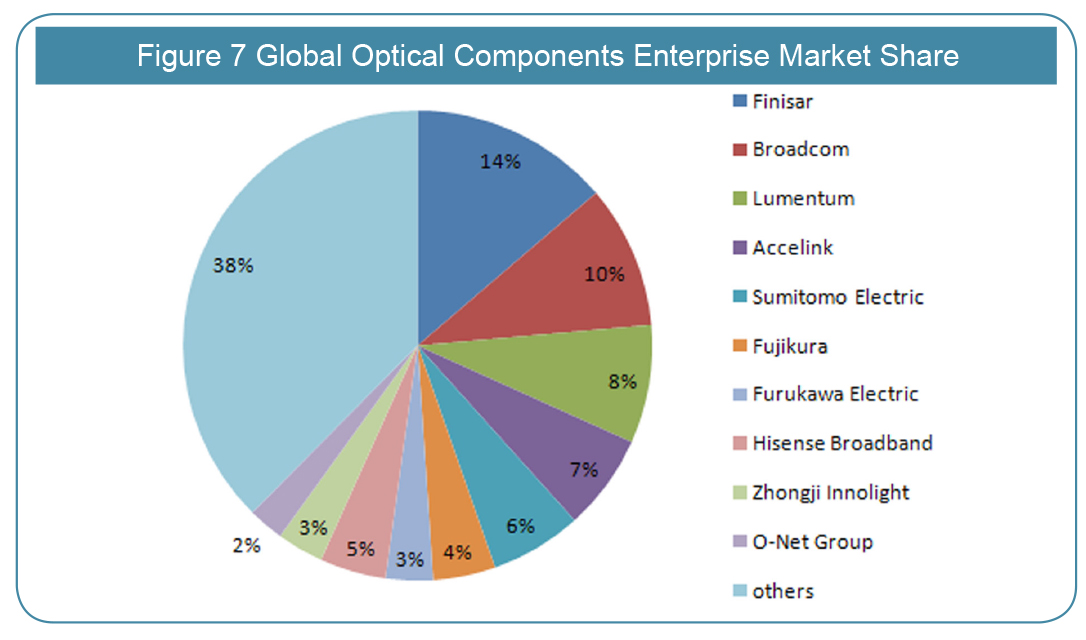
Optical communication components technology is necessary and strategic with perspectiveness, pioneer, and exploration in optical fiber communication industry, which shows a country’s technological innovation capability in optical fiber communication technology field. It is worth mentioning that among the top 10 optical components manufacturers in the world, three are from the United States, three are from Japan, and the remaining four are from China. This proves that Chinese companies have made great progress in the field of optical components and are narrowing the gap with United States and Japan. Accelink is still in fourth place this year, the same ranking as last year, while Hisense Broadband Multimedia, Zhongji Innolight and O-NET ranks 8th, 9th and 10th, respectively. Finisar, Broadcom and Lumentum score 1000, 995 and 977, respectively, in the top three, with little difference in competitiveness. In terms of market share, First-ranked Finisar occupies 14% of the market share, while the second and third places of Broadcom and Lumentum are 10% and 8%, respectively; the fourth Accelink’s market share is 7 percent; the remaining three Chinese enterprises Hisense Broadband Multimedia, Zhongji Innolight and O-NET rank 8th, 9th and 10th with 5 percent, 3 percent and 2 percent market share, respectively, while Sumitomo Electric, Fujikura and Furukawa Electric have market shares of 6 percent, 4 percent and 3 percent, respectively. These ten enterprises account for 62% of the optical components market.


Combined with new situations and requirements in optical fiber & cable market, Network Telecom Information Research Institute has researched China’s optical fiber & cable market and compiled industry prosperity index since in 2015 with the hope of exposure of the latest trend and offering valuable decision reference.


Industry prosperity index in 2018 shows that China’s optical fiber & cable market is still in the stage of rapid upgrading of network infrastructure. Industry coincident composite index is 106.5 (Q2=100 in 2016, similarly hereinafter) in the third quarter in 2018, increasing by 0.74 than the previous quarter. The growth is obvious. Leading composite index is 108.7 which increases by 1.8 than the previous quarter. Lagging composite index is 107.60, rising by 0.15 than the previous quarter. As both leading and coincident composite index are in the growing state, the optical fiber & cable industry in China will keep a stable development.

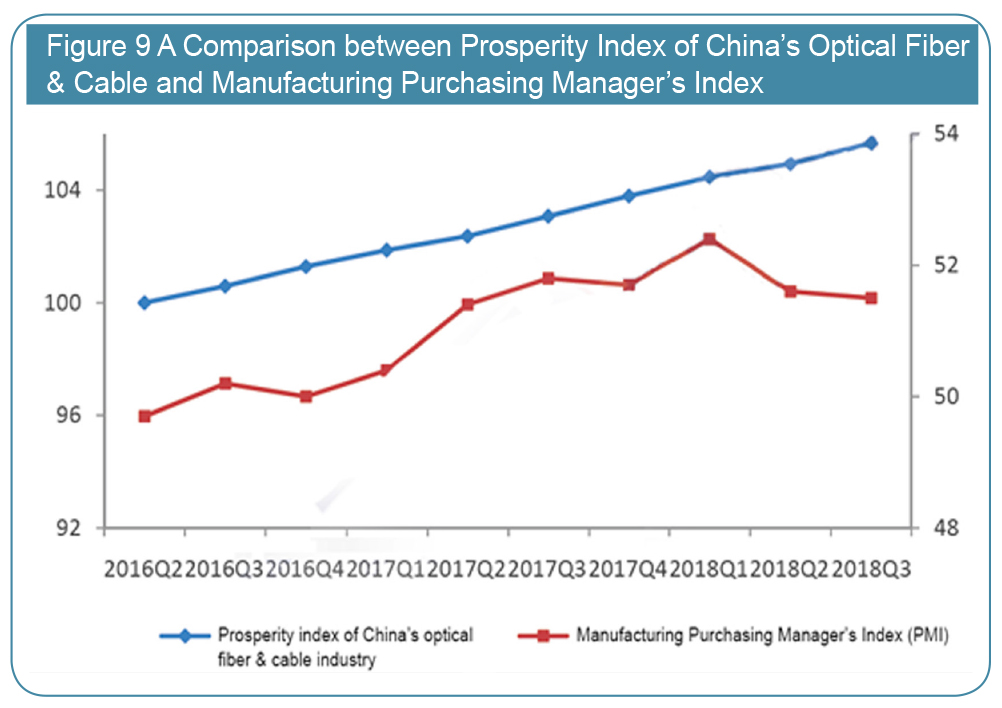
The trend of coordinate development is more and more evident between the network infrastructure optical fiber & cable industry and entity economy. China’s Purchasing Manager’s Index (PMI) is usually regarded as a good sign of entity economy to measure the conditions of China’s manufacturing sector in production, new orders, products price, inventory, employees, order to deliver (OTD), new export orders as well as imports. Figure 5 shows that prosperity index of optical fiber & cable industry has existed an obvious positive correlation with Purchasing Manager’s Index from the second quarter in 2016 to the third quarter in 2018. Optical fiber & cable industry grows steadily, and the growth of entity economy is more evident, both of which generally have a positive trend, and the correlation coefficient is about 0.86. Therefore the trend of coordinate development is more and more evident between the optical fiber & cable industry and entity economy.
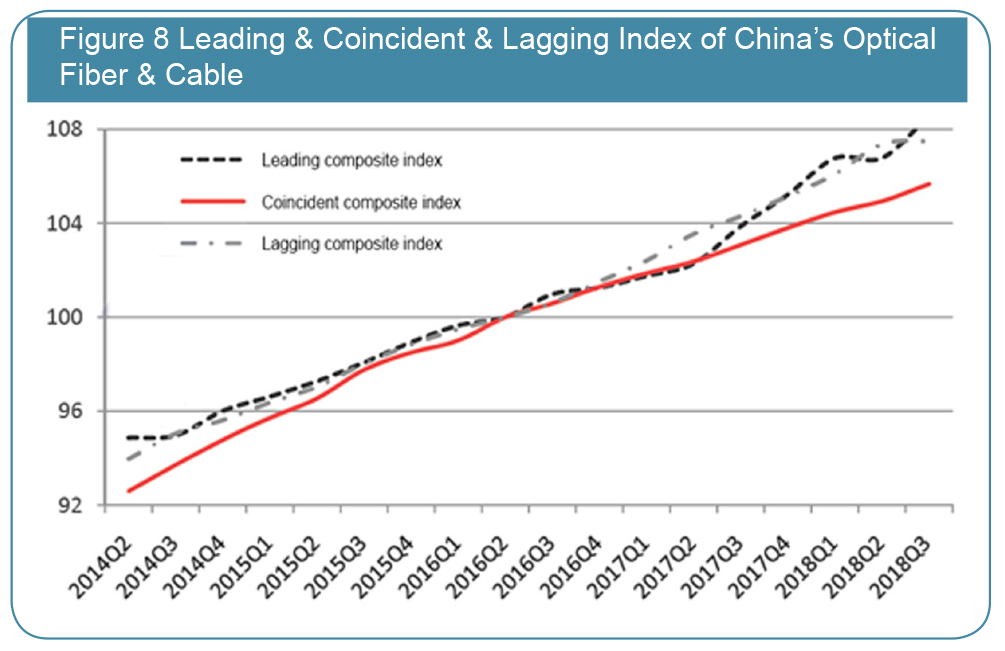
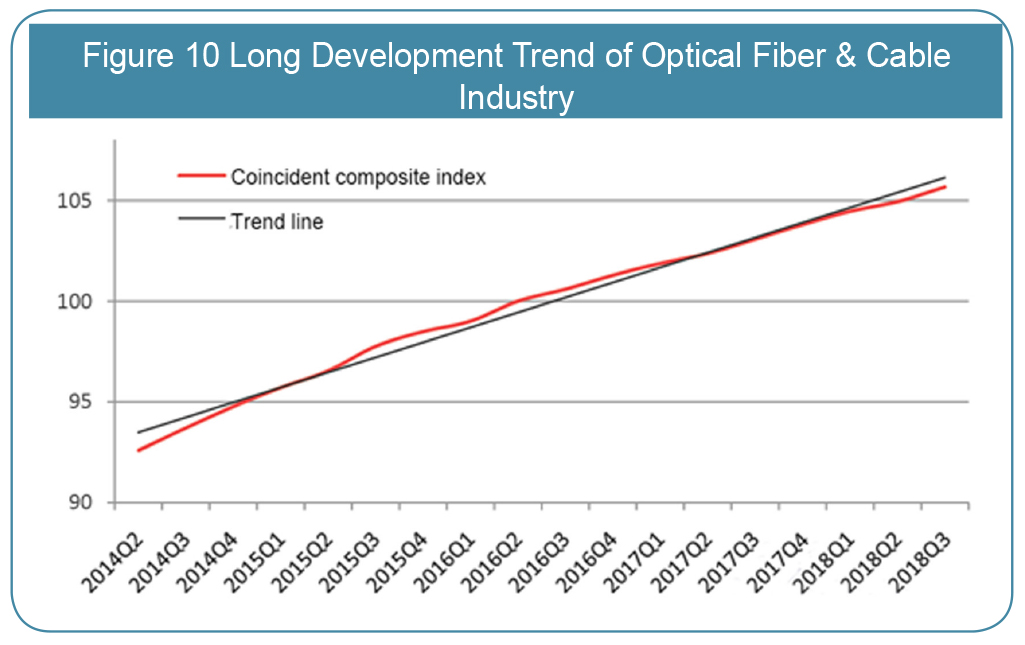
Trend analysis of prosperity index
Prosperity index of China’s optical fiber & cable industry mainly reflects the overall trend of Internet industry through coincident Index, and predicts future developing state through leading index. Next we focus on the analysis of coincident and leading index.

1. Analysis of coincident index
From the long perspective, coincident index keeps a steady growth. Accelerating upgrade of network infrastructure optical fiber cable, continuous growth of broadband users, Internet video, social network, electronic payment, cloud computing, as well as the steady expansion of new Internet mode and new business pattern such as energy Internet, all increase the market demand of network infrastructure optical fiber cable.

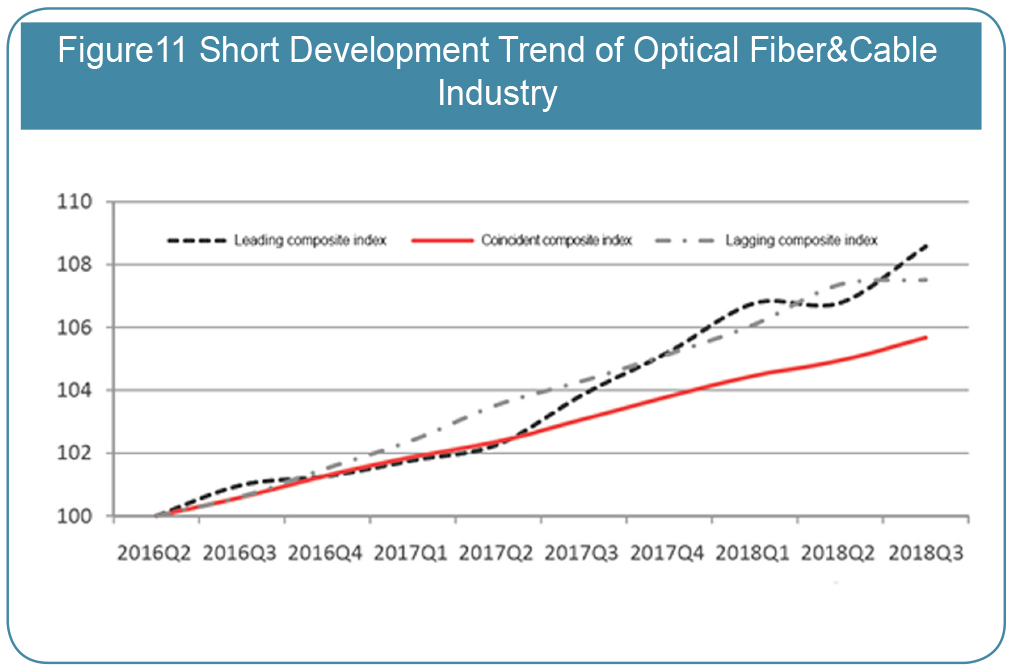
In the short term, coincident index grows steadily in the latest quarters. From the fourth quarter in 2017 to the third quarter in 2018, coincident index is respectively 103.81, 104.48, 104.95, and 105.68, increasing by 0.71, 0.66, 0.47, and 0.72 on quarter to quarter. The steady growth of coincident index demonstrates that China’s optical fiber & cable industry generally keeps a positive development trend.
The wide spread of broadband networks and the further integration with the real economy are the important factors supporting the continuous and rapid development of optical fiber and cable industry in network infrastructure. In the second quarter of 2018, mobile Internet access traffic rose 21.9 percent from a month earlier; number of mobile broadband users reached 1.2 billion, up 6.0 percent from a month earlier; Internet video, electronic payment, cloud computing and other services achieved double-digit growth. In the first quarter of 2018, due to the impact of short video services, the average daily on-demand volume of online video increased by 14.1% compared with the month before, and the amount of electronic payment business increased 25.8% from month to month. The cashless society accelerated its progress. Cloud computing market scale, compared to the last quarter, achieved growth of 21.8%, becoming an important driving force for the rapid development of optical fiber and cable industry.

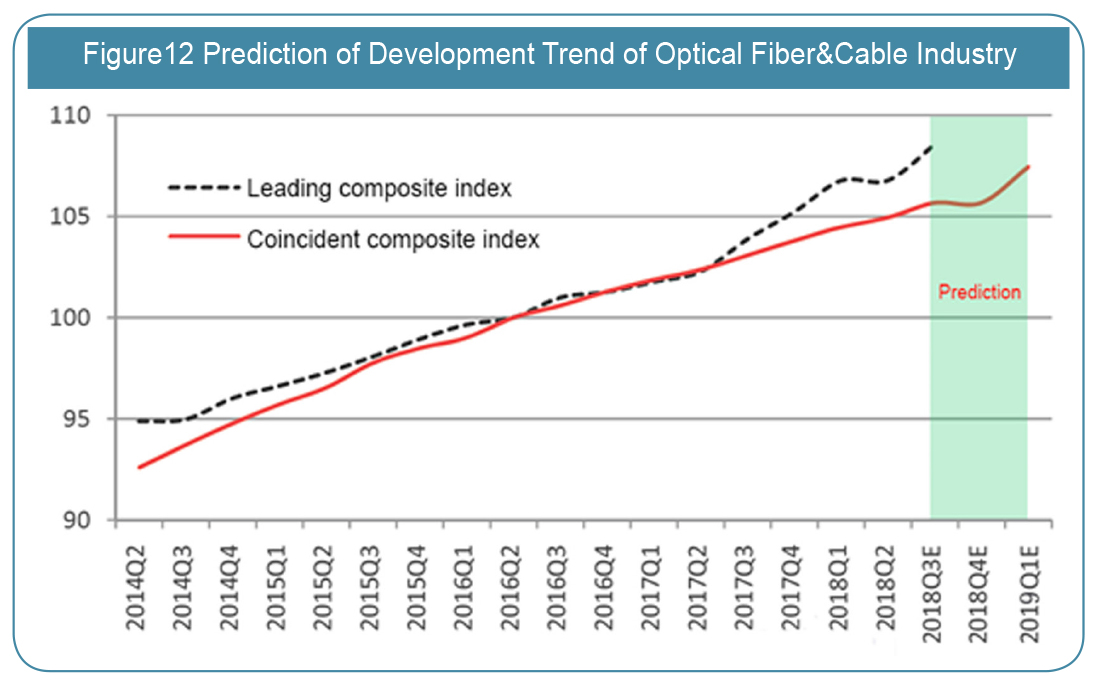
2. Analysis of leading index
Leading composite index continues to rise, and it is respectively 106.79 and 108.58 in the last two quarters, increasing by 0.02 and 1.8 on quarter to quarter, which shows that optical fiber & cable industry still has a strong potential.
Leading index predicts that China’s optical fiber & cable industry will continue to grow in the next two quarters. Analysis of peaks and troughs finds that the variation of both leading index and coincident index is regular and harmonious. And leading index averages 2 quarters lead over coincident index. As the following figure shows, leading index of China’s optical fiber & cable industry continues to maintain positive growth from the second quarter to the third quarter in 2018. Thus it’s predicted that China’s optical fiber & cable industry will continue to keep a steady growth in the next quarters (2018 Q4 - 2019 Q1).

In the end, I’m honored to express my sincere gratitude to all partners in optical communication industry for their long-term help and support on behalf of all staffs of “ The Annual Top 10 Competitiveness Enterprises in the China/Global Optical Communication Field ”. Thank you!

Full-time Member of Standing Committee on Communication Technology of Ministry of Industry and Information Technology

Chairman of Asia-Pacific Optical Communications Committee

Chief Editor of "Network Telecom" Magazine
Oct 2018


Mao Qian


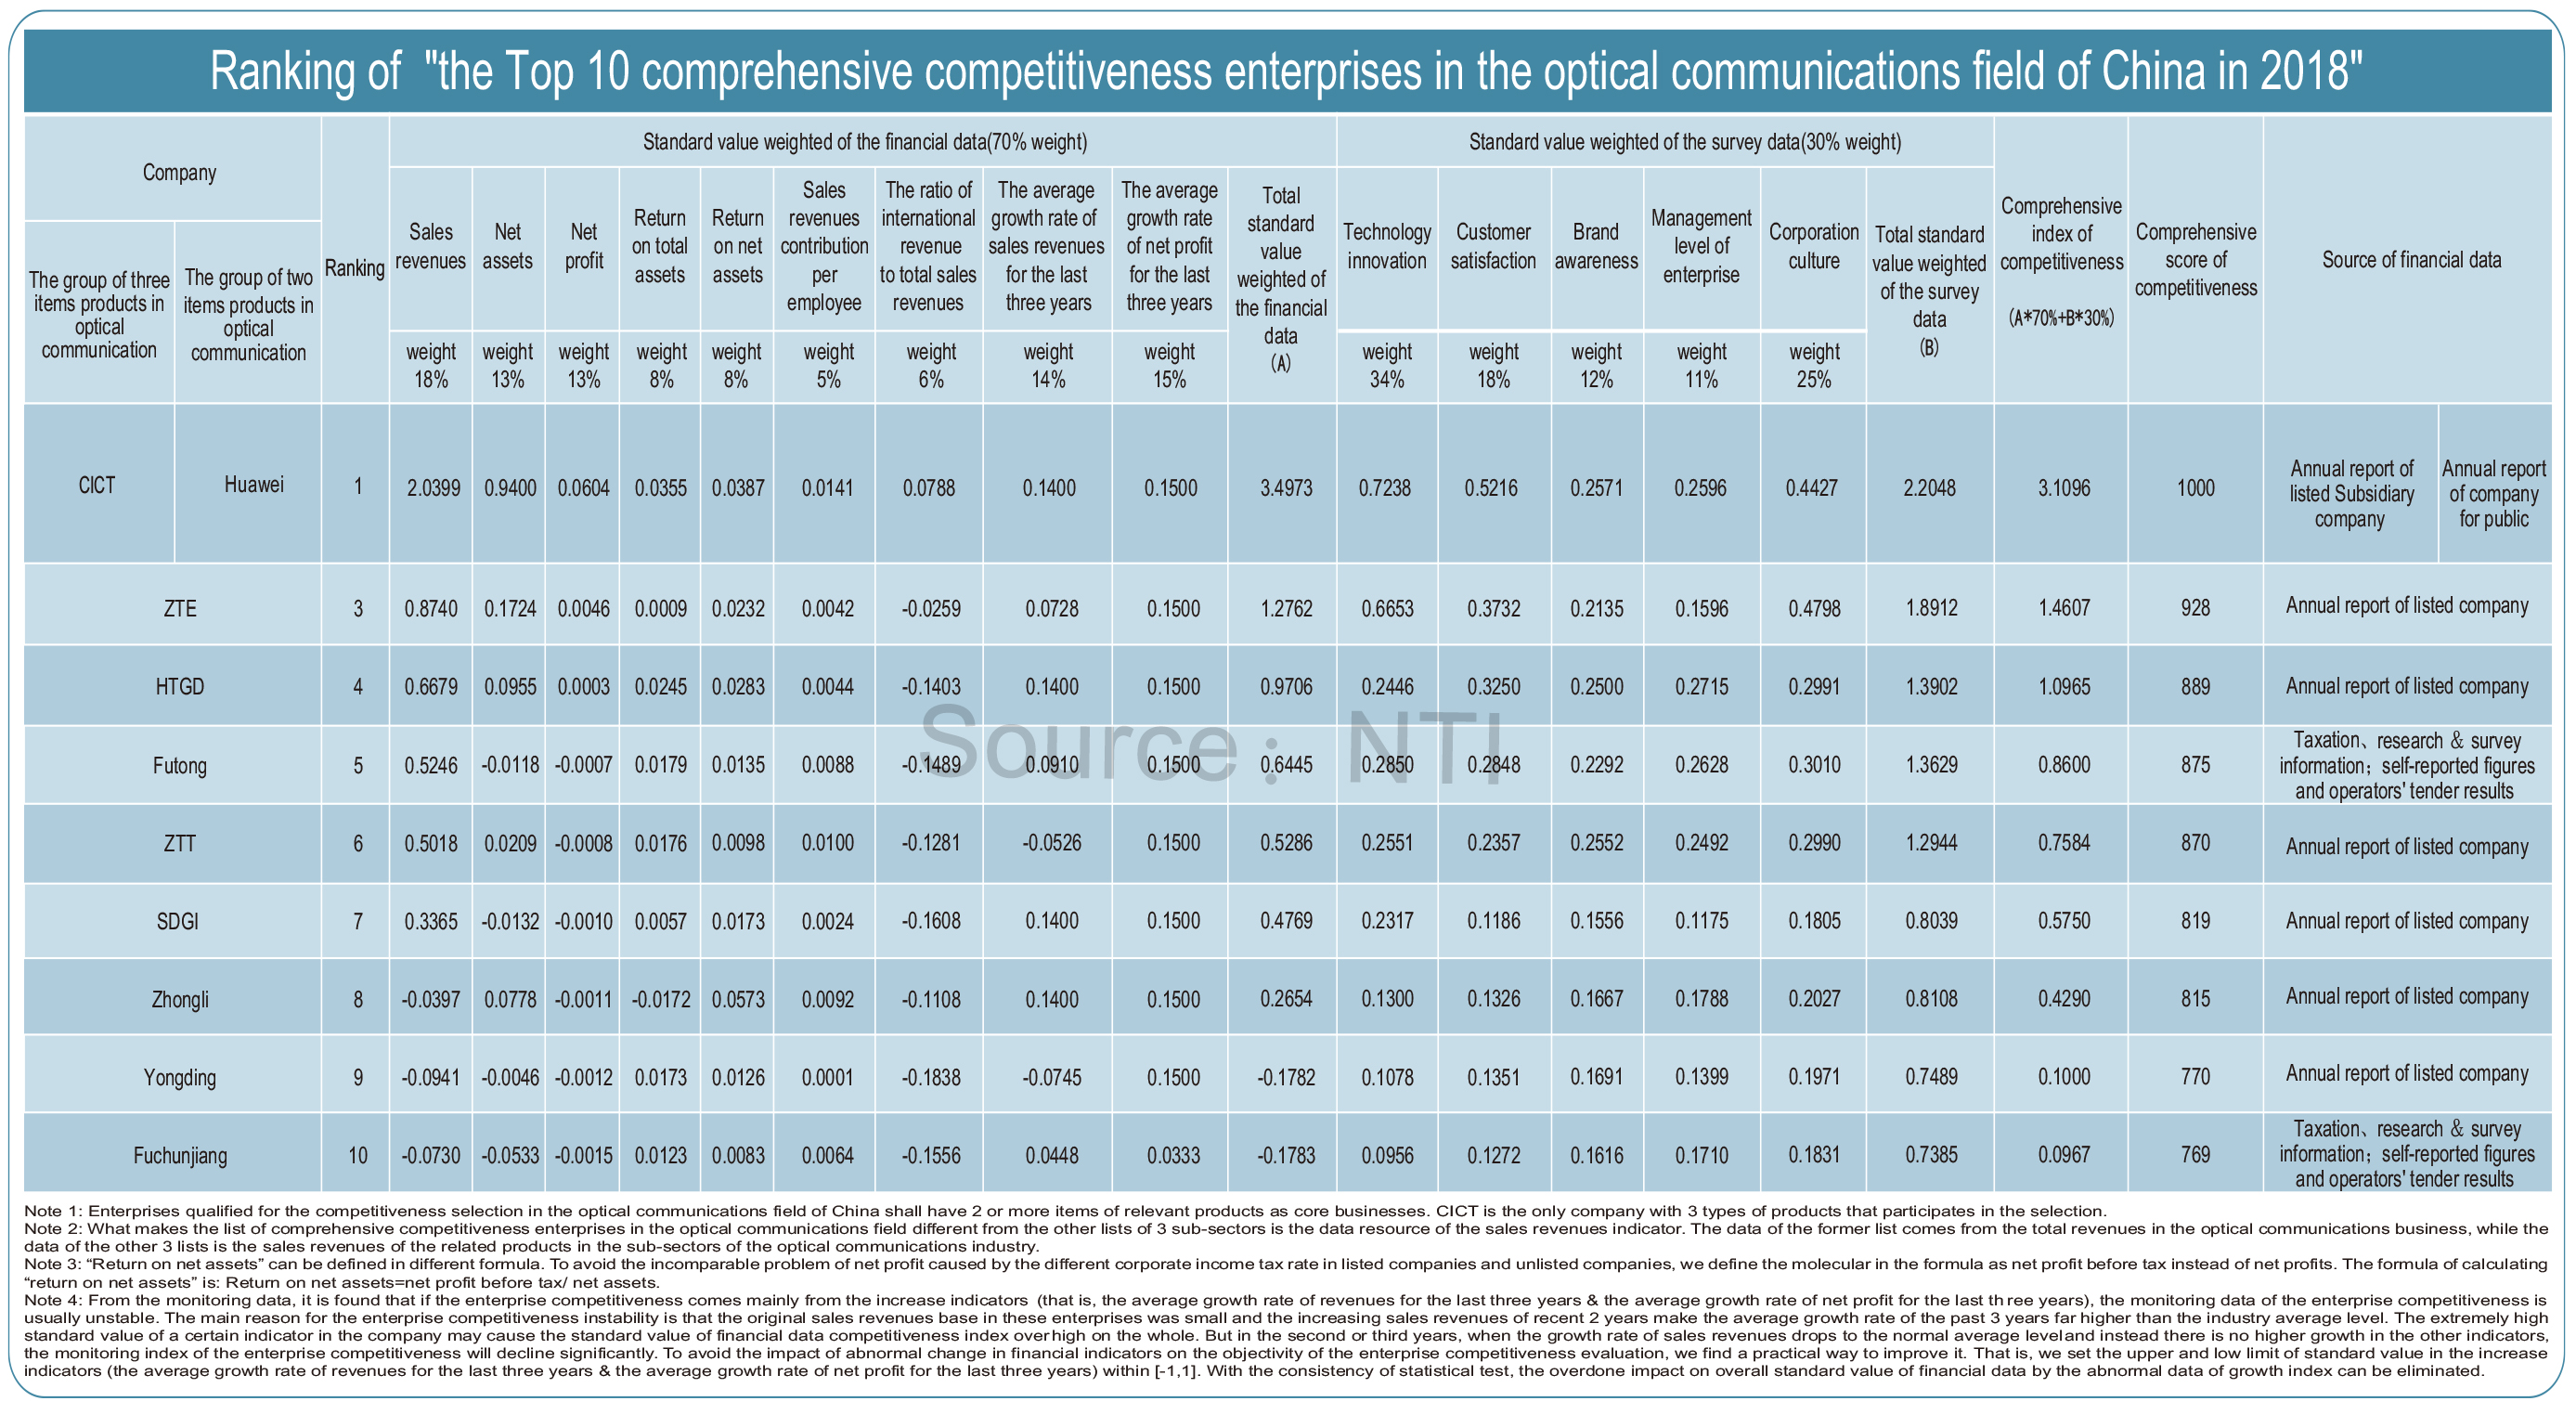
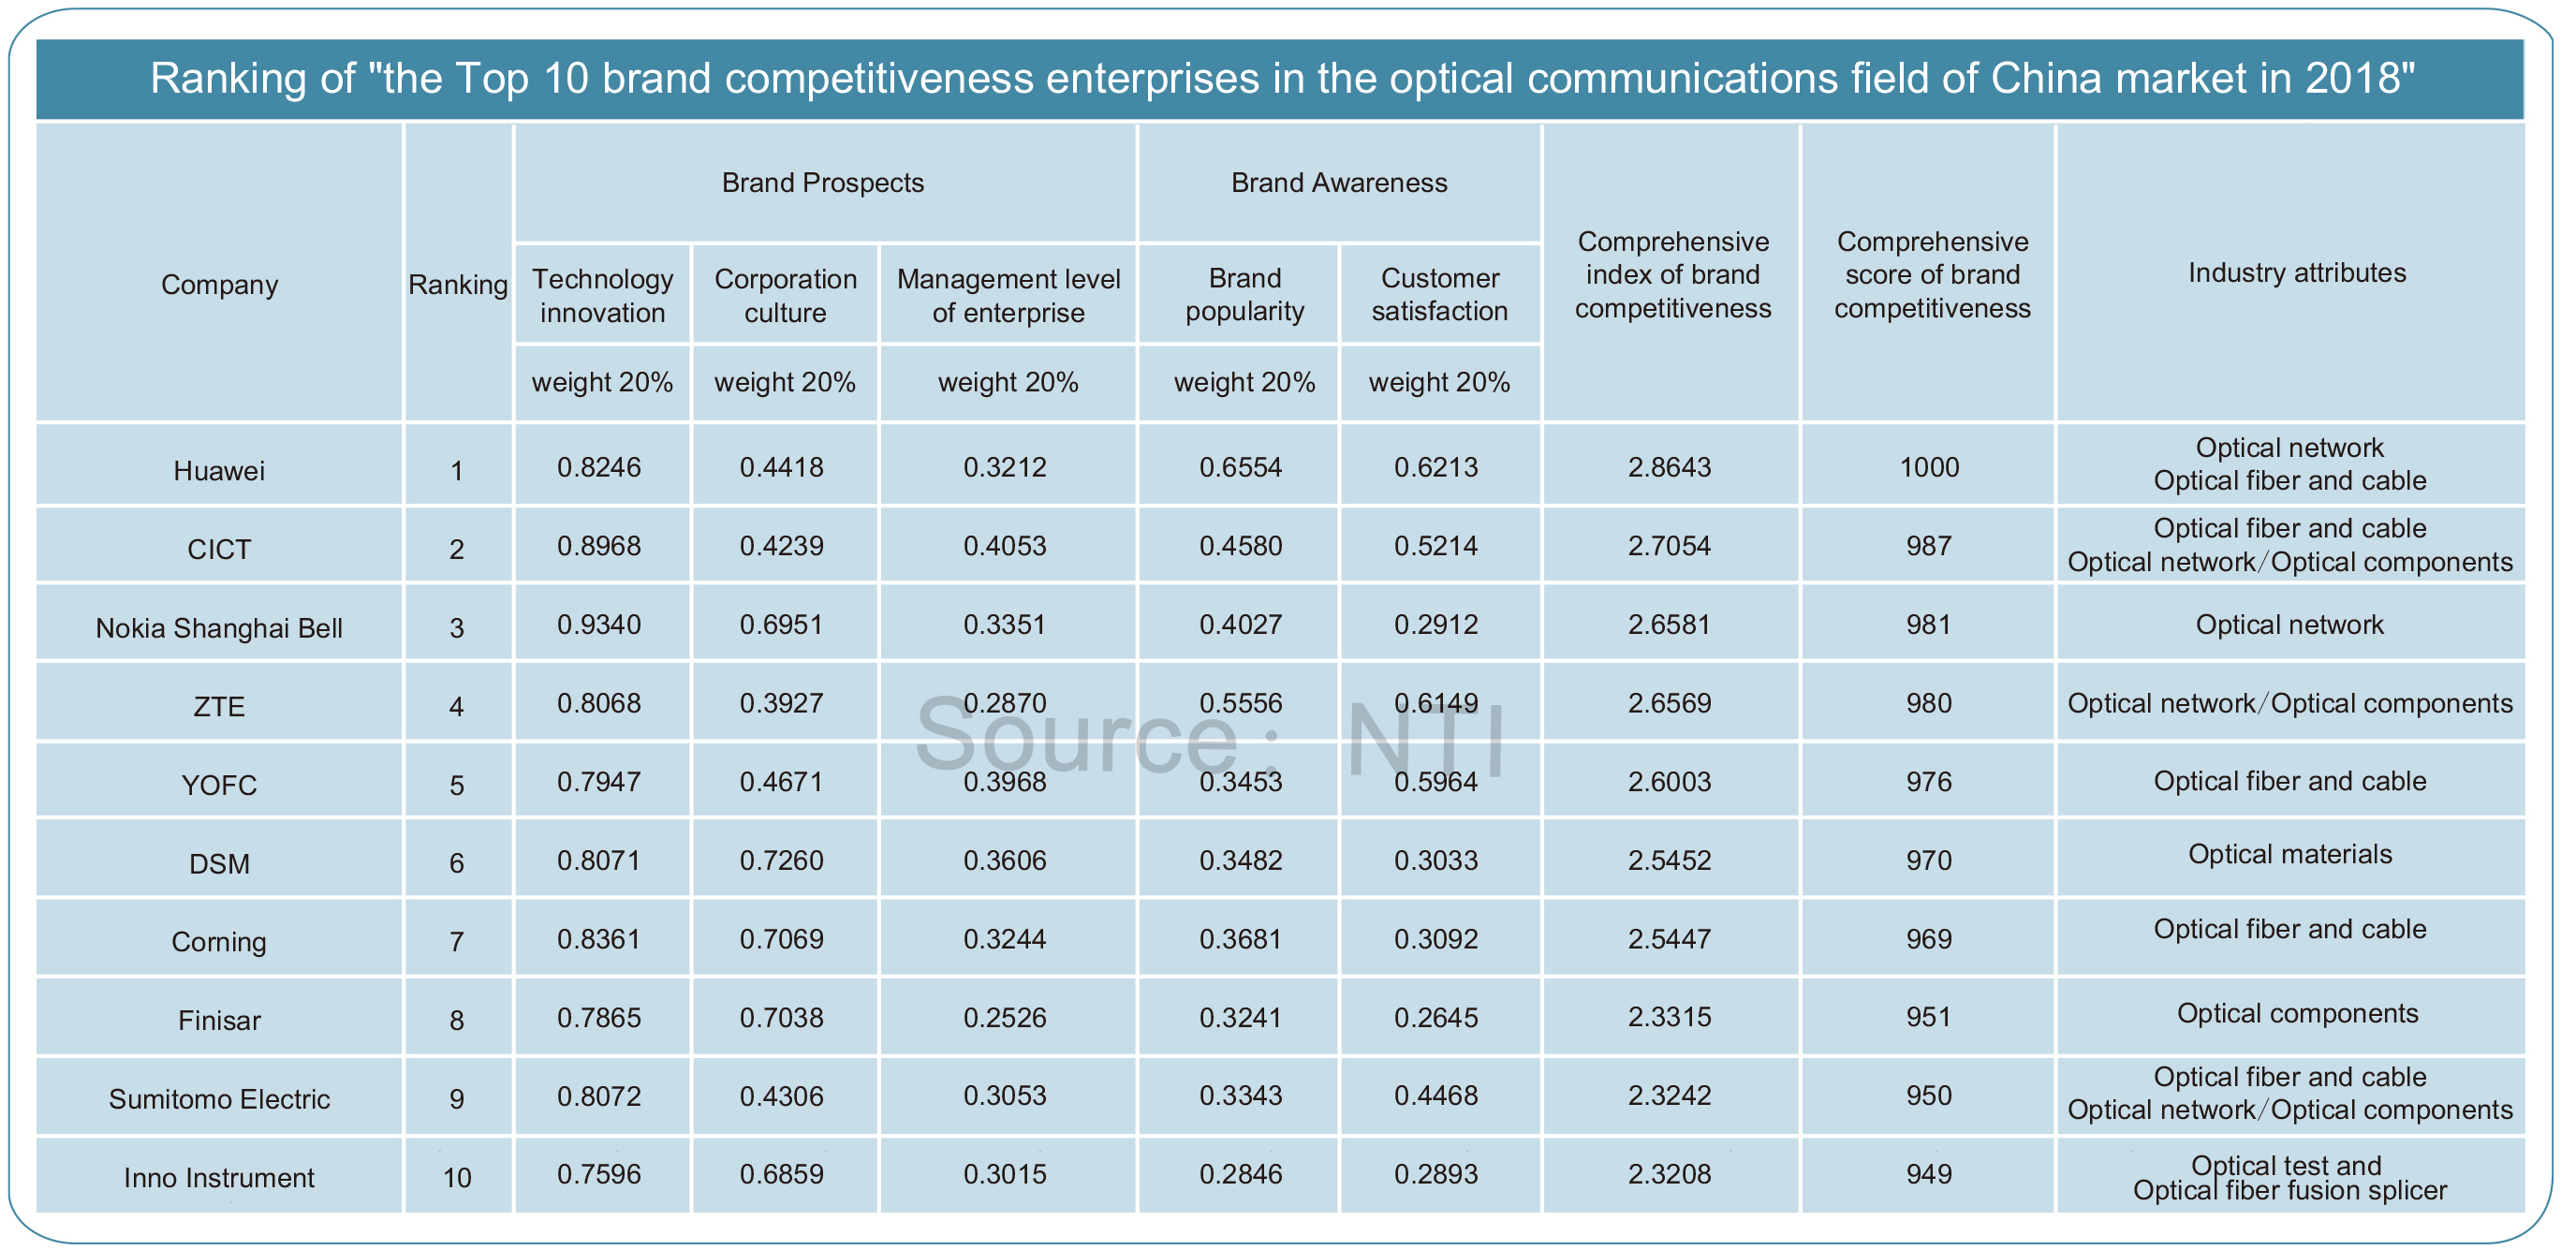
Ranking of "The Top 10 Competitiveness Enterprises in the Optical Communications Industry of China & Global market in 2018"


Adress:701, Building 6, No.555 Dongchuan Rd, Zizhu National Hi-Tech Industrial Development Zone, Shanghai, China Zip Code:200241
Tel:021-54830451 ,54830452,54830497 Fax:021-54429643