In the past year, each country in the world was actively laying out high speed 5G optical communication network.Verizon, the biggest wireless communication company in America, initially announced in July 2016 that 28GHz fixed broadband wireless access acted as 5 G standard on the base of simplification of TD-LTE (not support MIMO &higher order modulation), and planed to implement it commercially in 2017. As estimated, America need invest130-150 billion dollars to support Broadband competition, rural coverage, and mobile communication intensive stations in 5-7 years, and the investment in optical communication will take up 14%- 18% of network operators’ revenue.In 2017, Chinese government aimed at speeding up the construction of 5G network so as to build the country into a “cyber power”, and greatly prompted “One Belt One Road” strategy and “Broadband China” strategy. The urban broadband access rate in China will increase to 50 Mbps in 2018, and at least 100 Mbps, partially up to 1Gbps in 2020.German released “digital strategy 2025” and built up full coverage gigabit fiber network as its support, and Italy planed to built up national high speed optical fiber network with 7 billion Euros etc., all of which have brought huge development space to the global optical fiber and cable market.
The total length of optical cable in June 2017 increased by 23.3% than that of in June 2016, and access cables, local cables & long distance cables respectively accounted for 65%, 32%, and 3% of the total length. In 2016, Chinese optical cable demand has increased to 207 million fiber core per kilometer, greatly taking up 57% of the world’s expected demands (375 million fiber core per kilometer). The global optical cable installation amount reached 382 million fiber core per kilometer, among which 207 million fiber core per kilometer optical cables were installed in China. This figure has surpassed the global installation amount including China in 2010. Only the biggest client in China--China Mobile’s optical cable installation amount has exceeded the total installation amount of all the network operators in North America,West Africa, East Europe and Middle East areas.
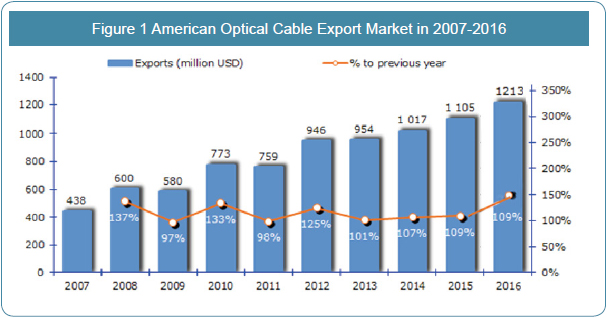
North American market also made a good performance. In 2016 the total export value of optical fiber & cable in America amounted up to 1.123 billion dollars, a year-on-year increase of 9.8%, contributing 19% to the global optical fiber & cable export amounts, which is secondary to China (market share of 23%).
Comprehensively, both domestic and international optical fiber & cable market demand developed fast in 2016.While main optical fiber & cable manufacturers had limited production capacity, resulting in the obvious increase of optical fiber price.
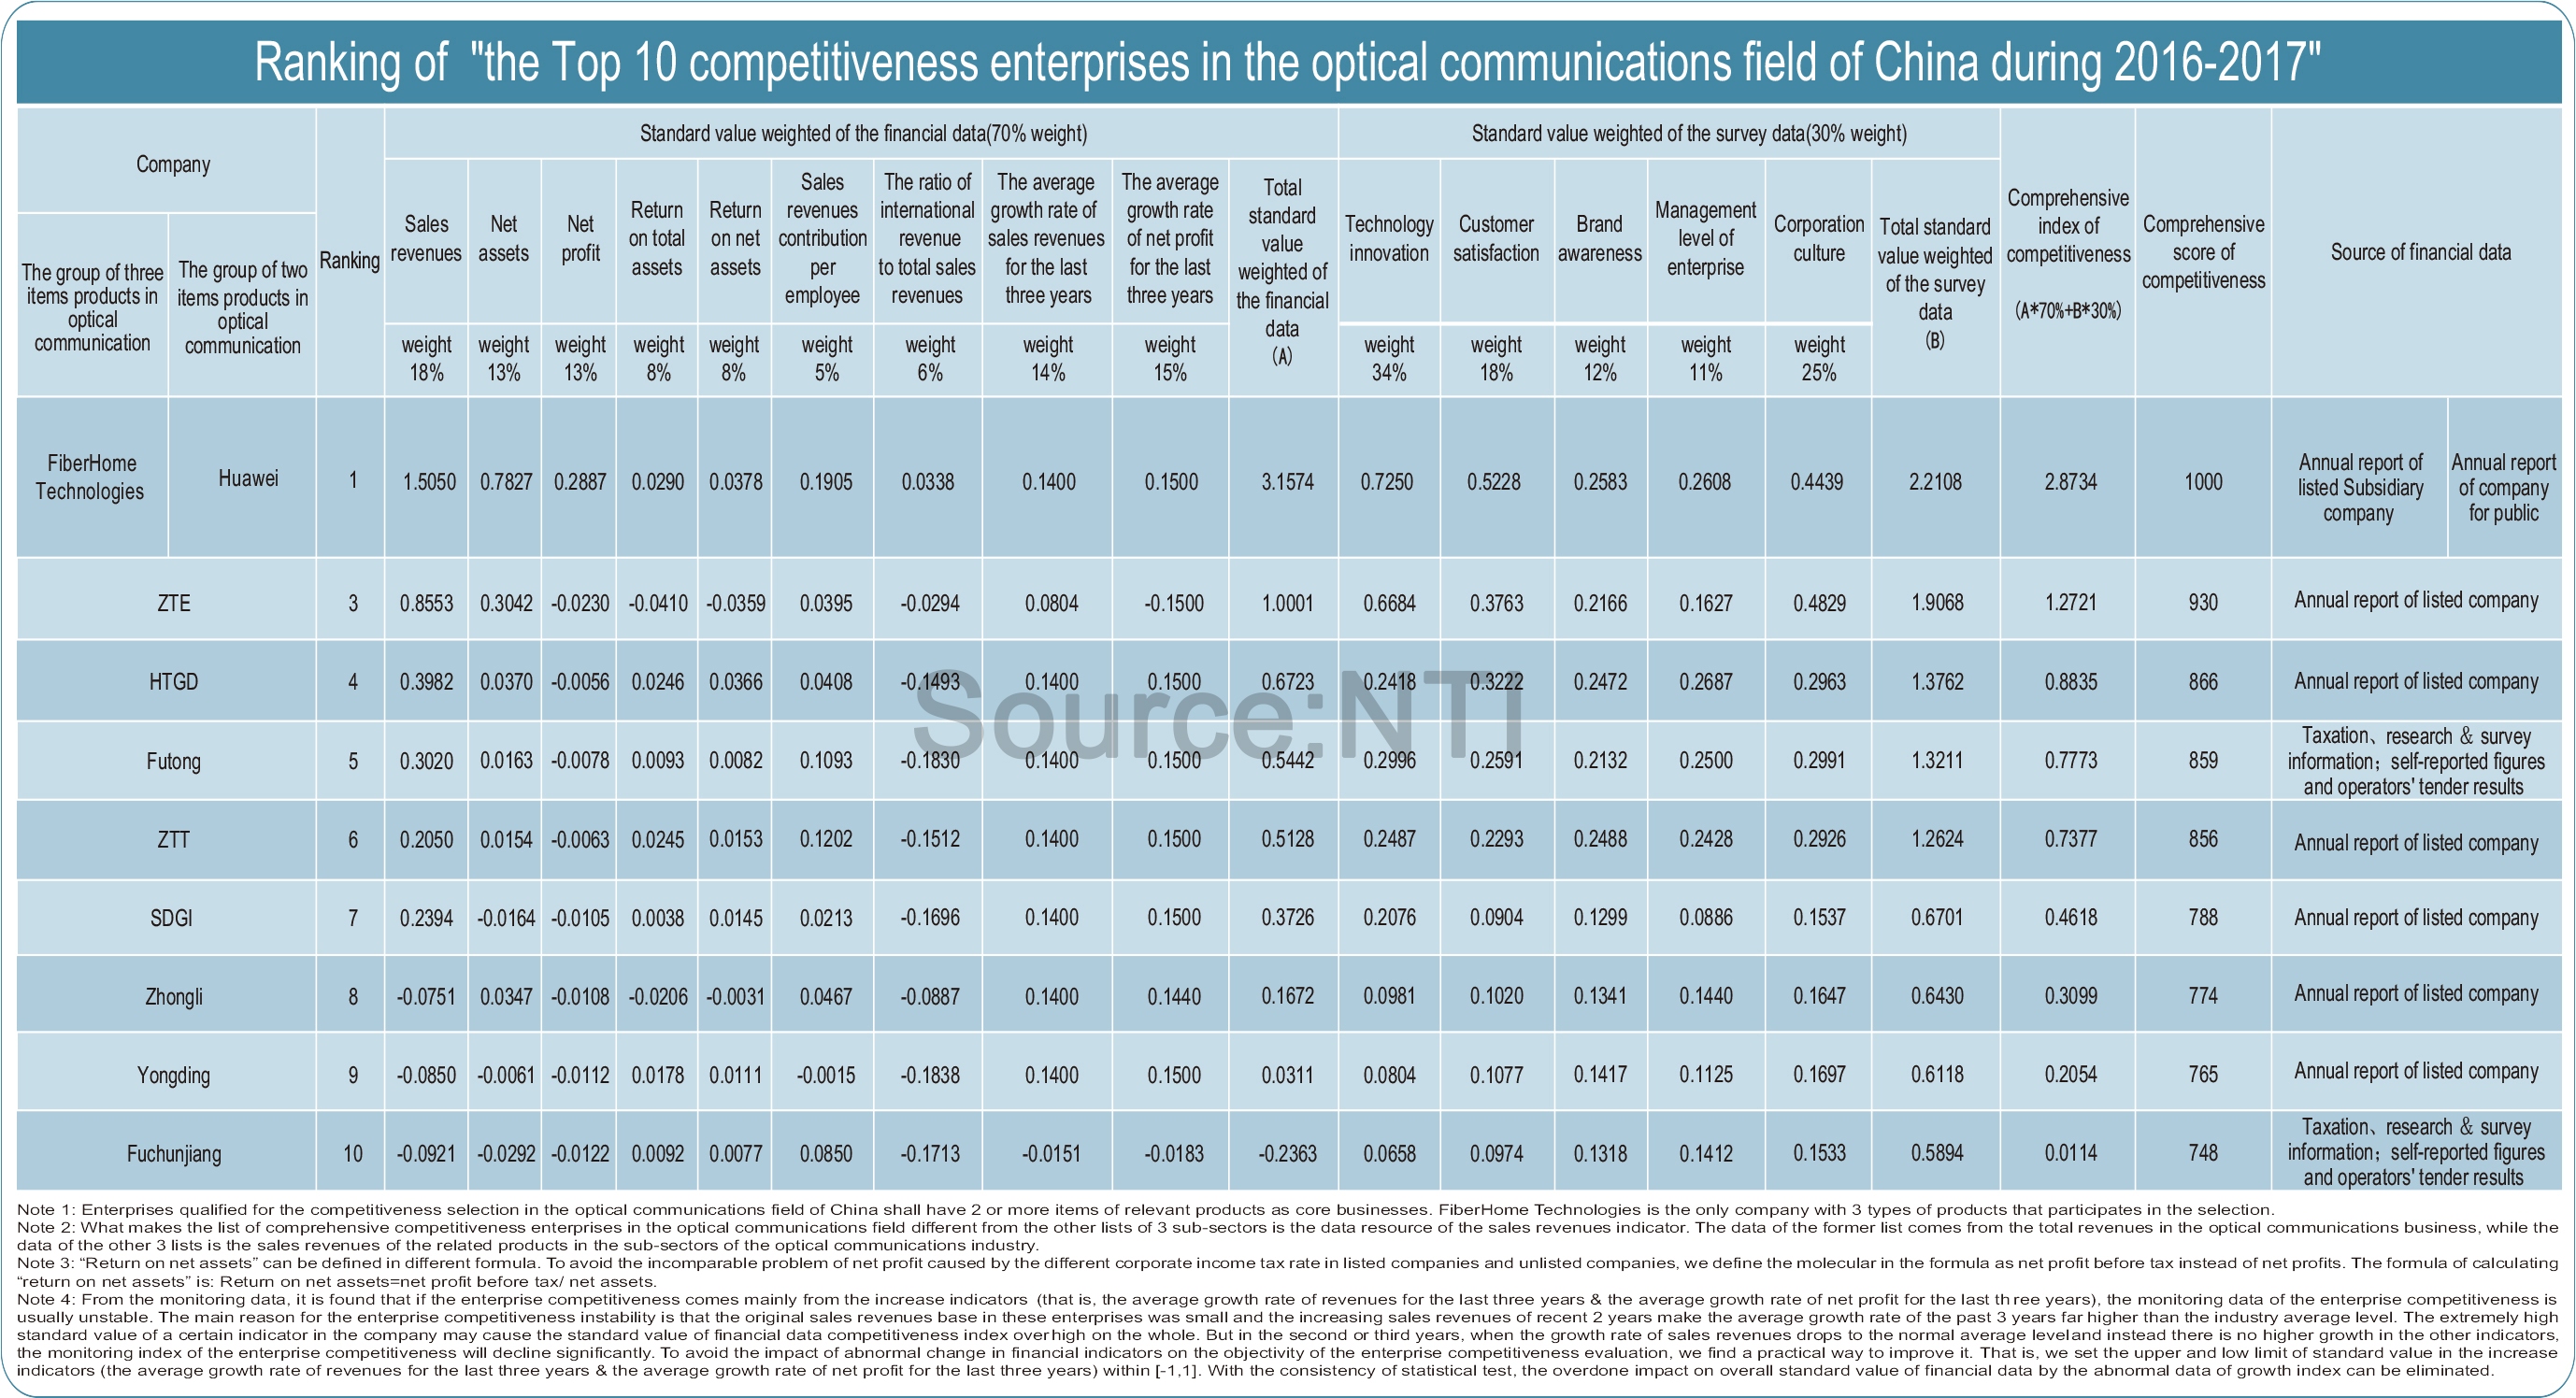
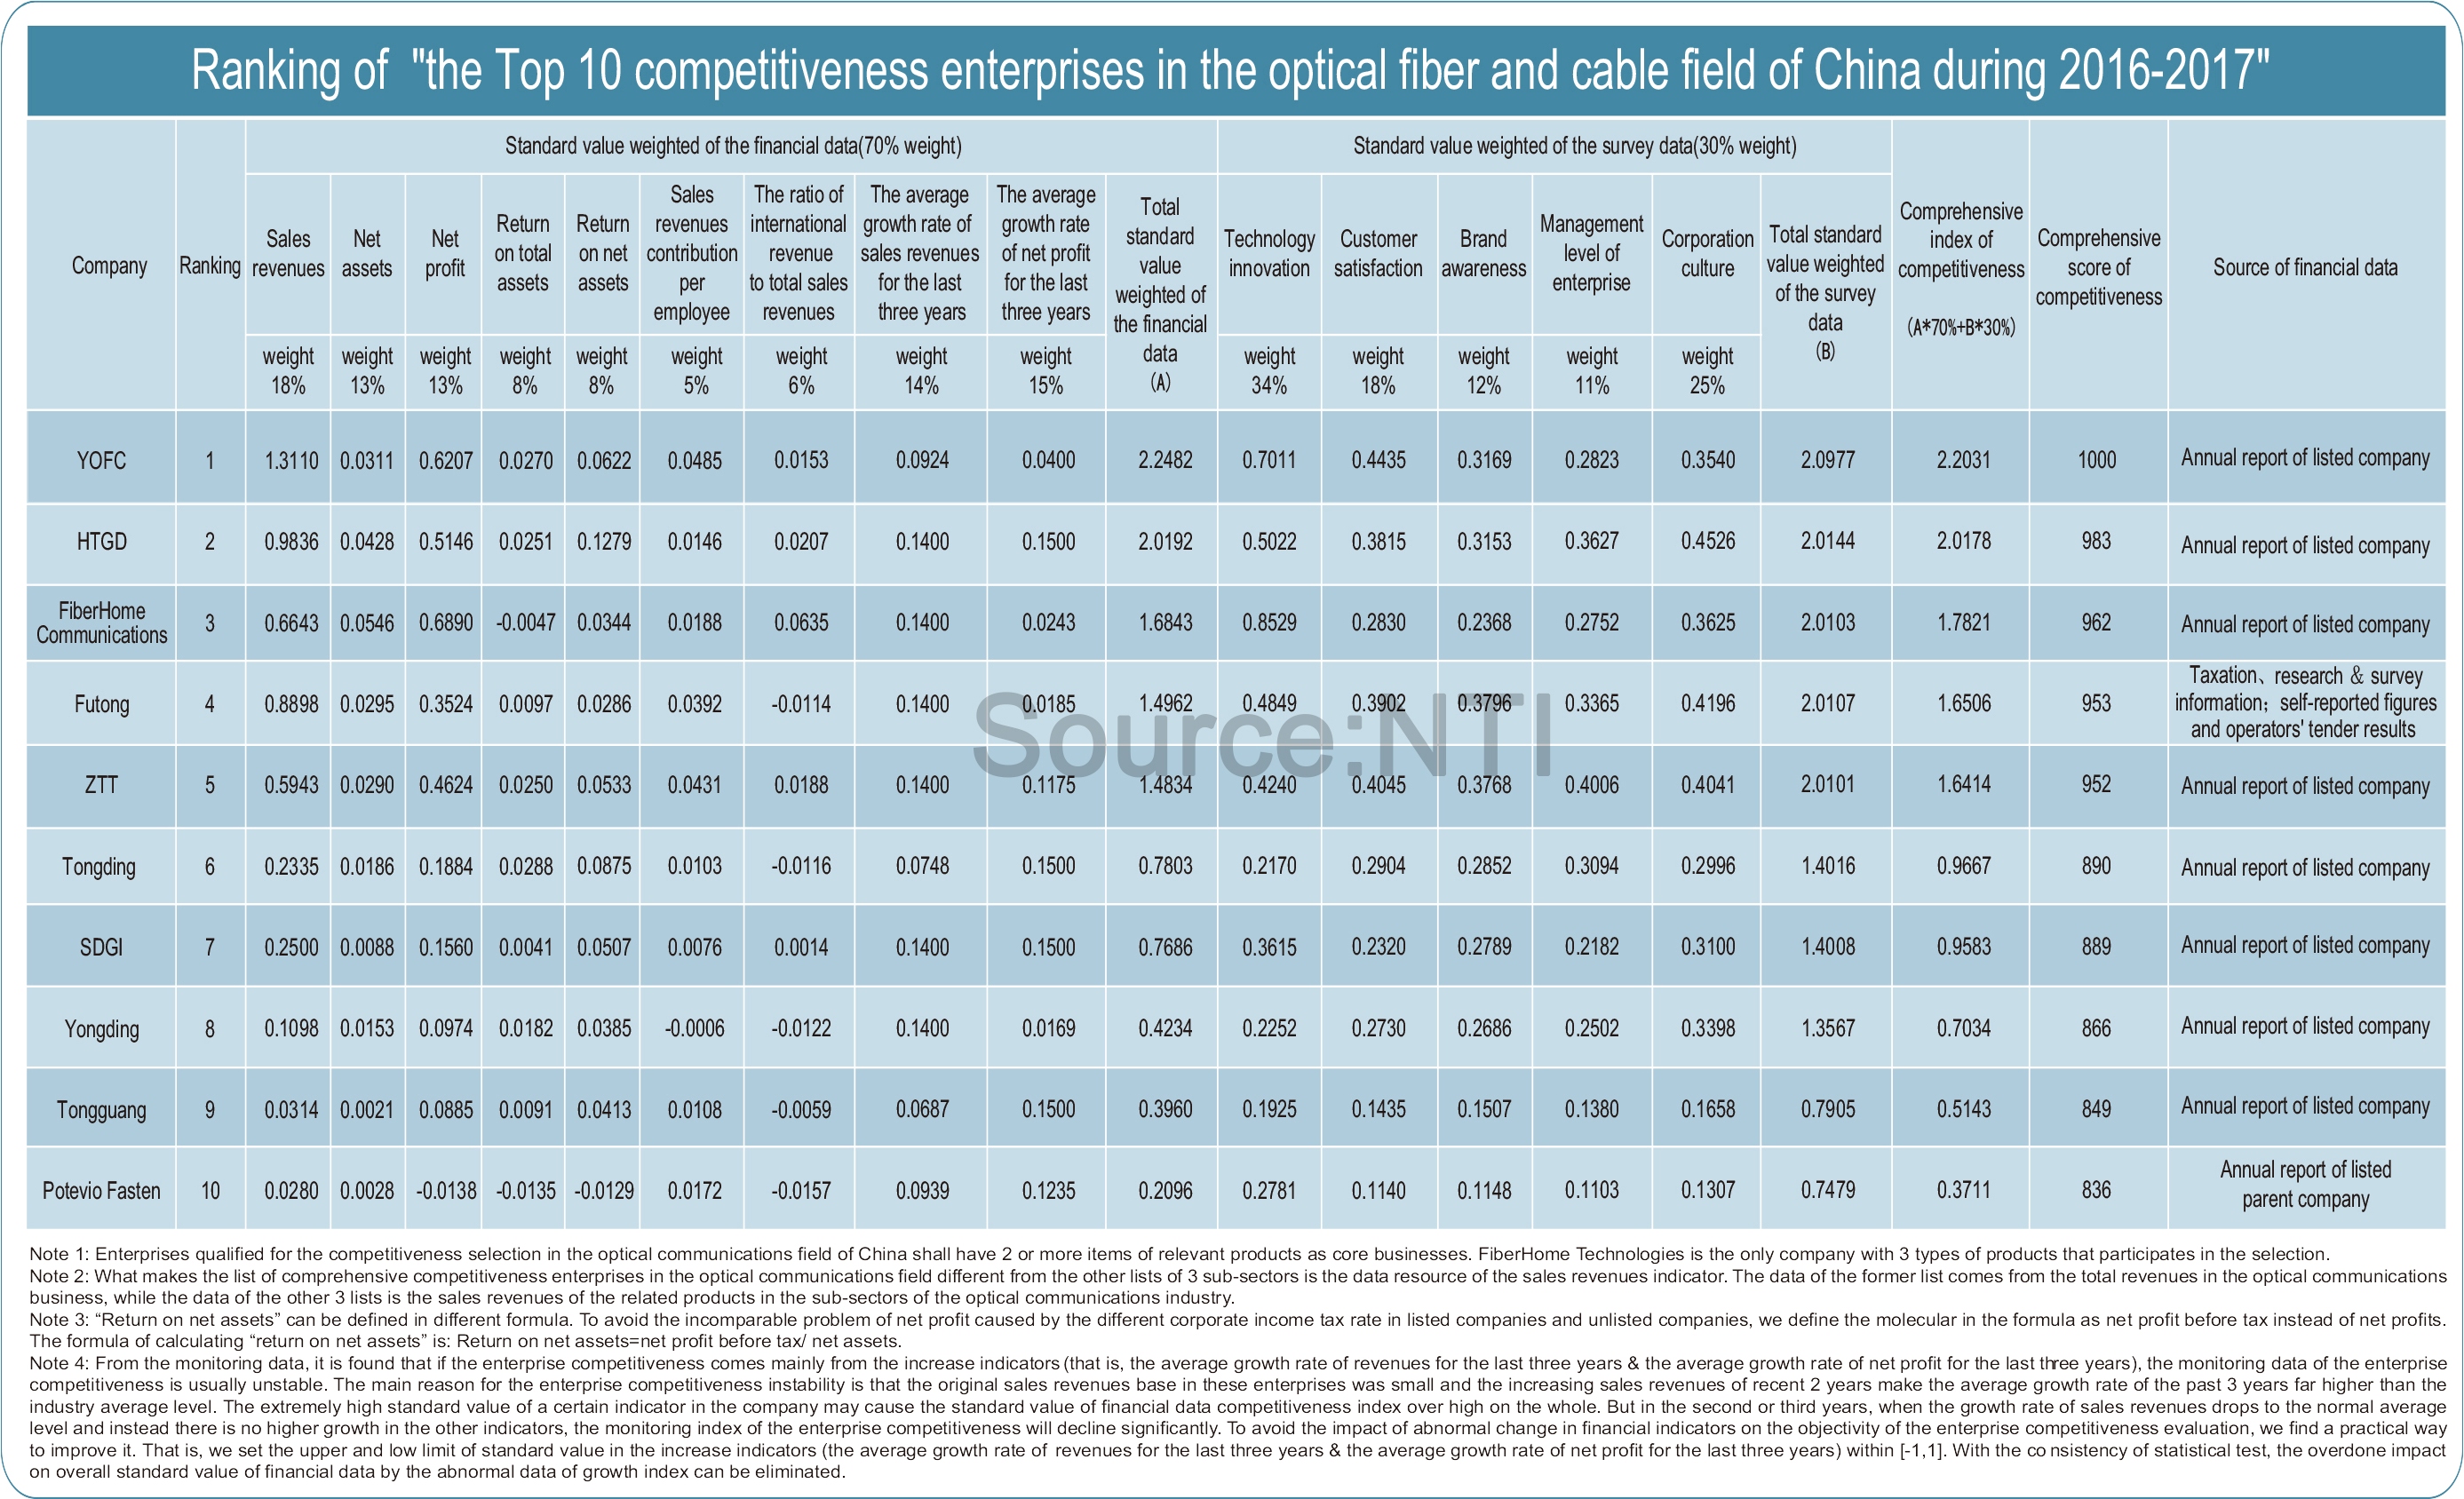
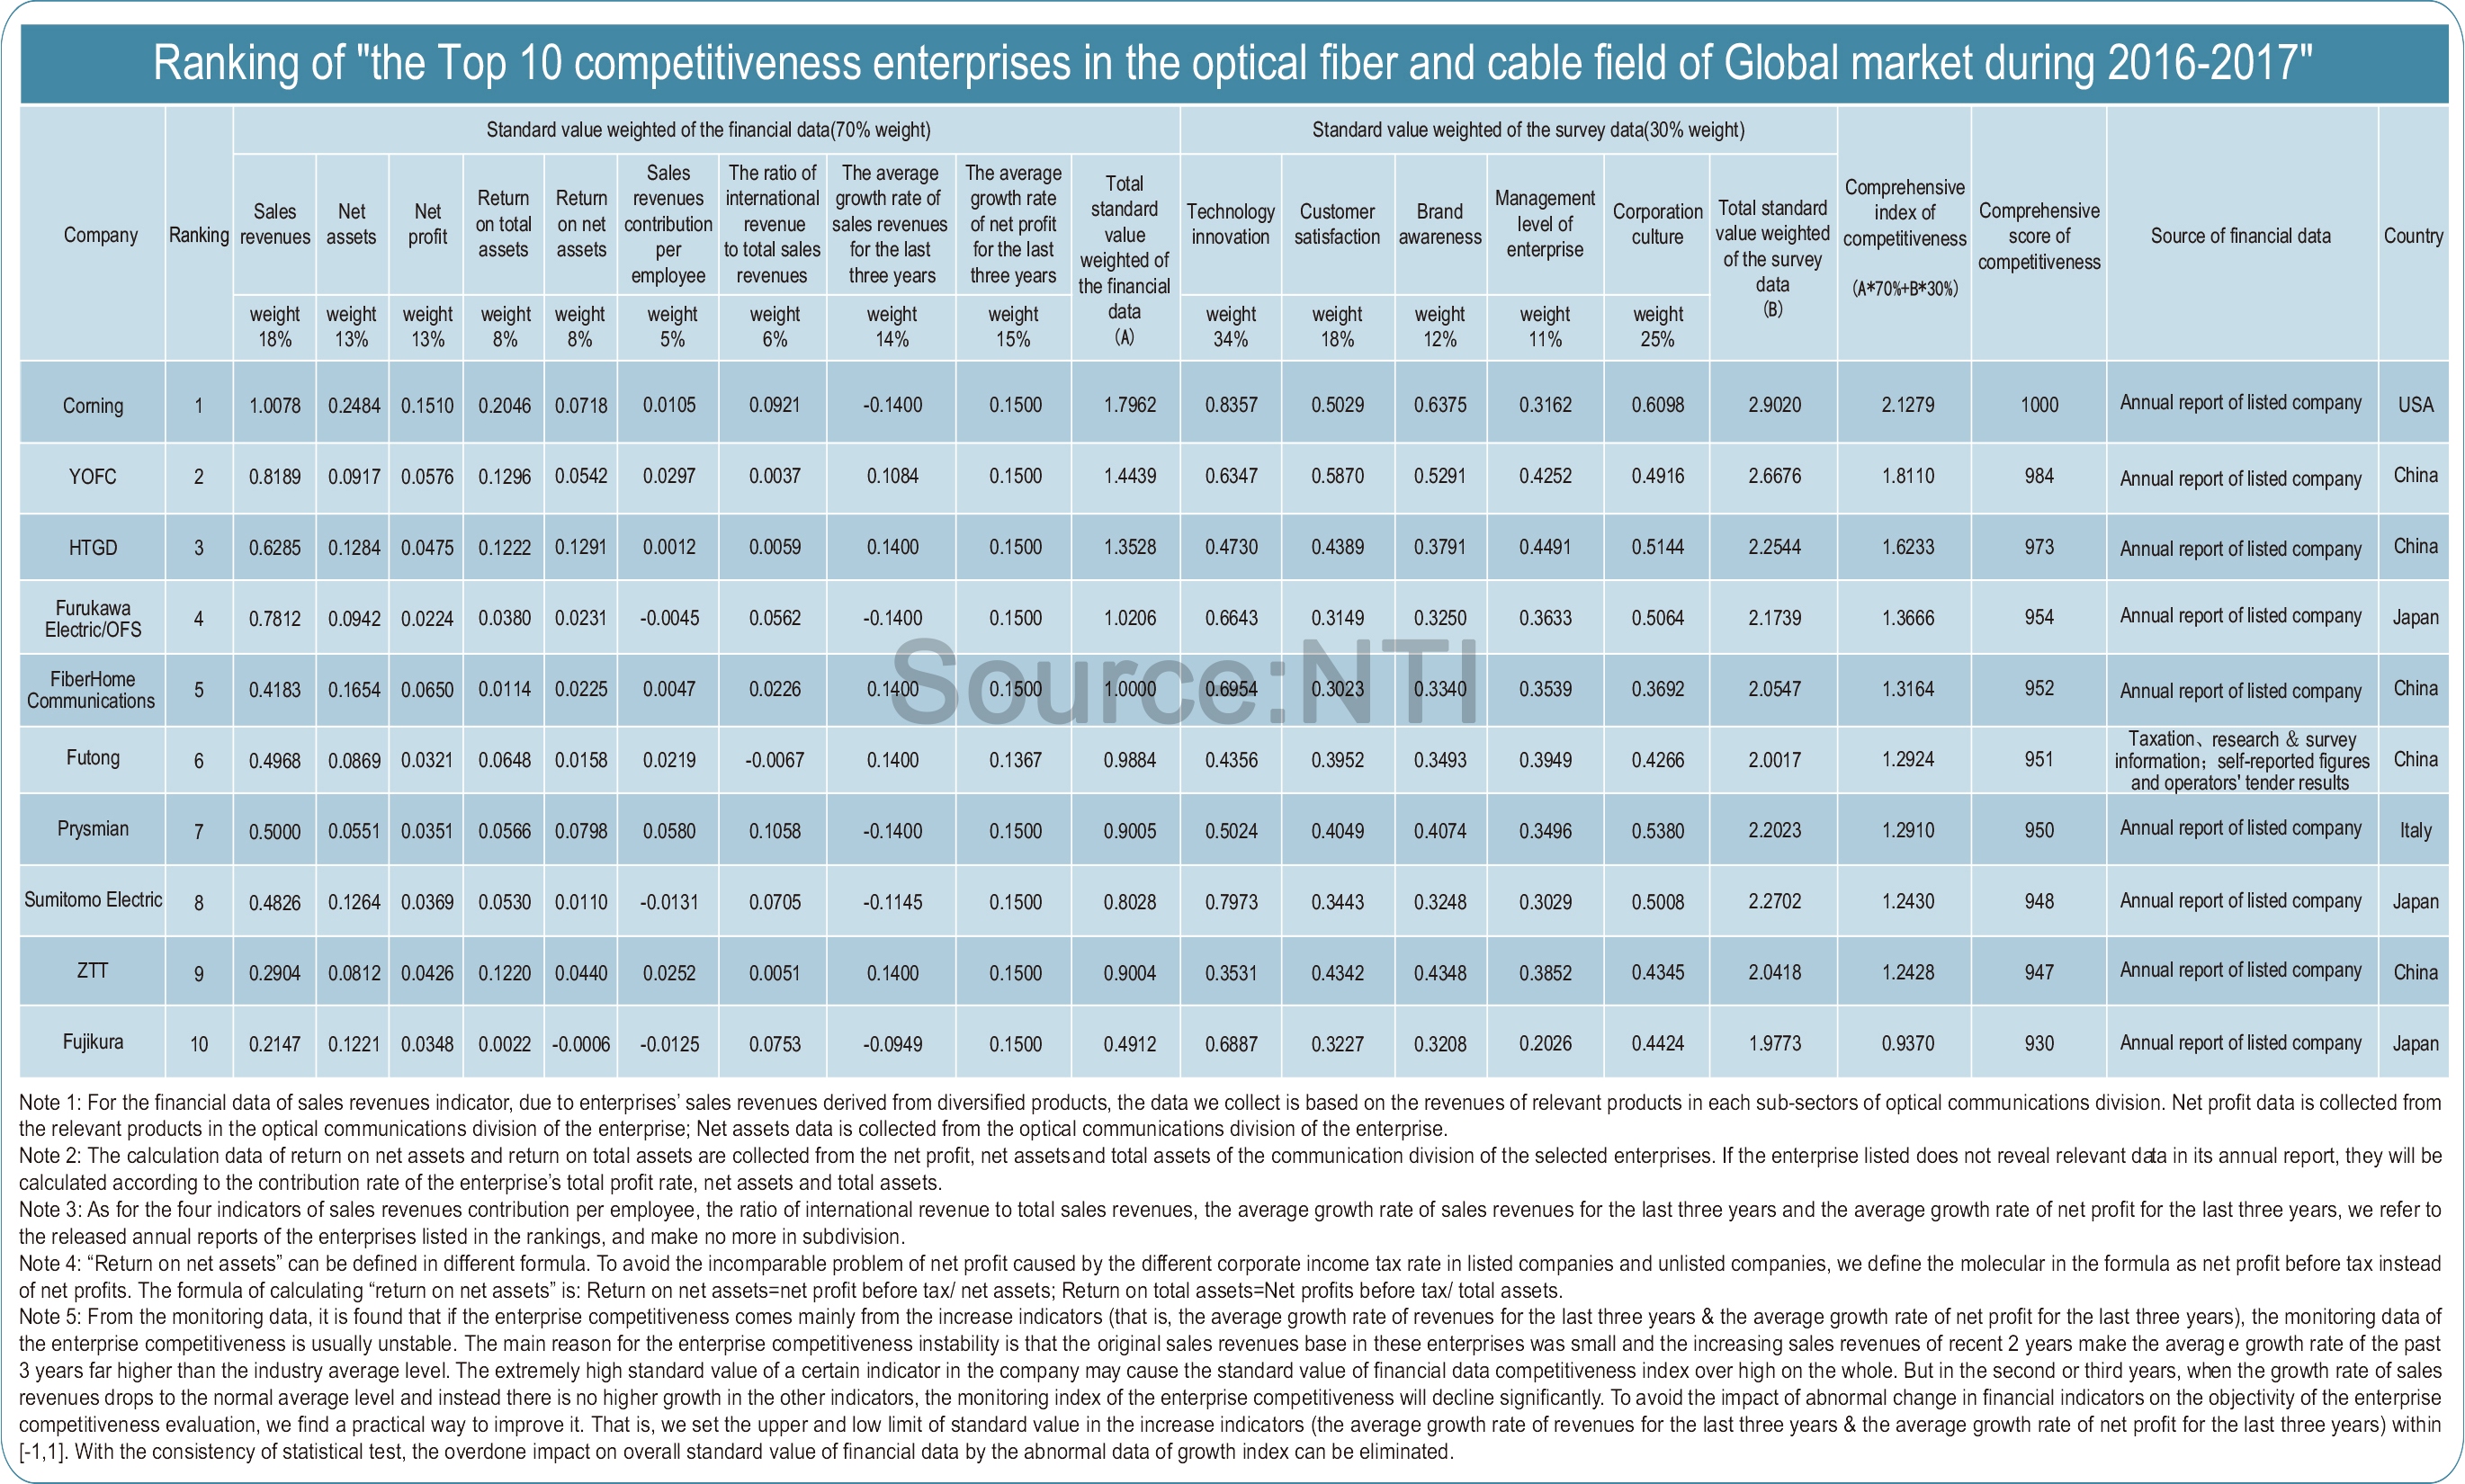
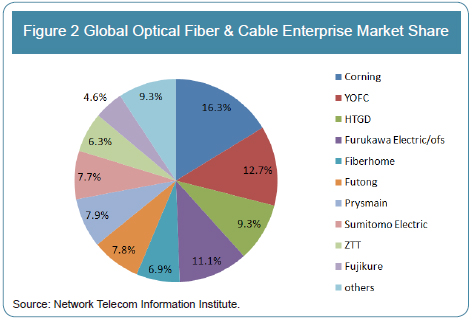
Network Telecom Information Research Institute has engaged in the competitiveness assessment of China/global optical fiber & cable enterprises for 11 years. “ The Top 10 Competitiveness Enterprises in the Global Optical Fiber &Cable Field During 2016-2017 ” clearly displays the competitive situations of main optical fiber & cable enterprises in2016-2017.
The research shows that China accounts for half market with a strong development among the top 10 competitiveness enterprises of global fiber & cable market, China accounts for half market, which is very strong. YOFC,HTGD, Fiberhome all take up great market share. YOFC ranks global number 2 with its 12.7% of market share;HTGD ranks global number 3 with its 9.3% of market share. And Fiberhome, Futong, ZTT respectively ranks 5th,6th, and 9th with market share of 6.9%, 7.8% and 6.3%. Corning, Prysmain, Furukawa Electronic/ ofs, Sumitomo Electric, Fujikure take up market share of 16.3%, 7.9%, 11.1%, 7.7% and 4.6% respectively. These 10 enterprises entirely take up 90.7% of global optic fiber and cable market share, showing strong market competitive advantage.
 |
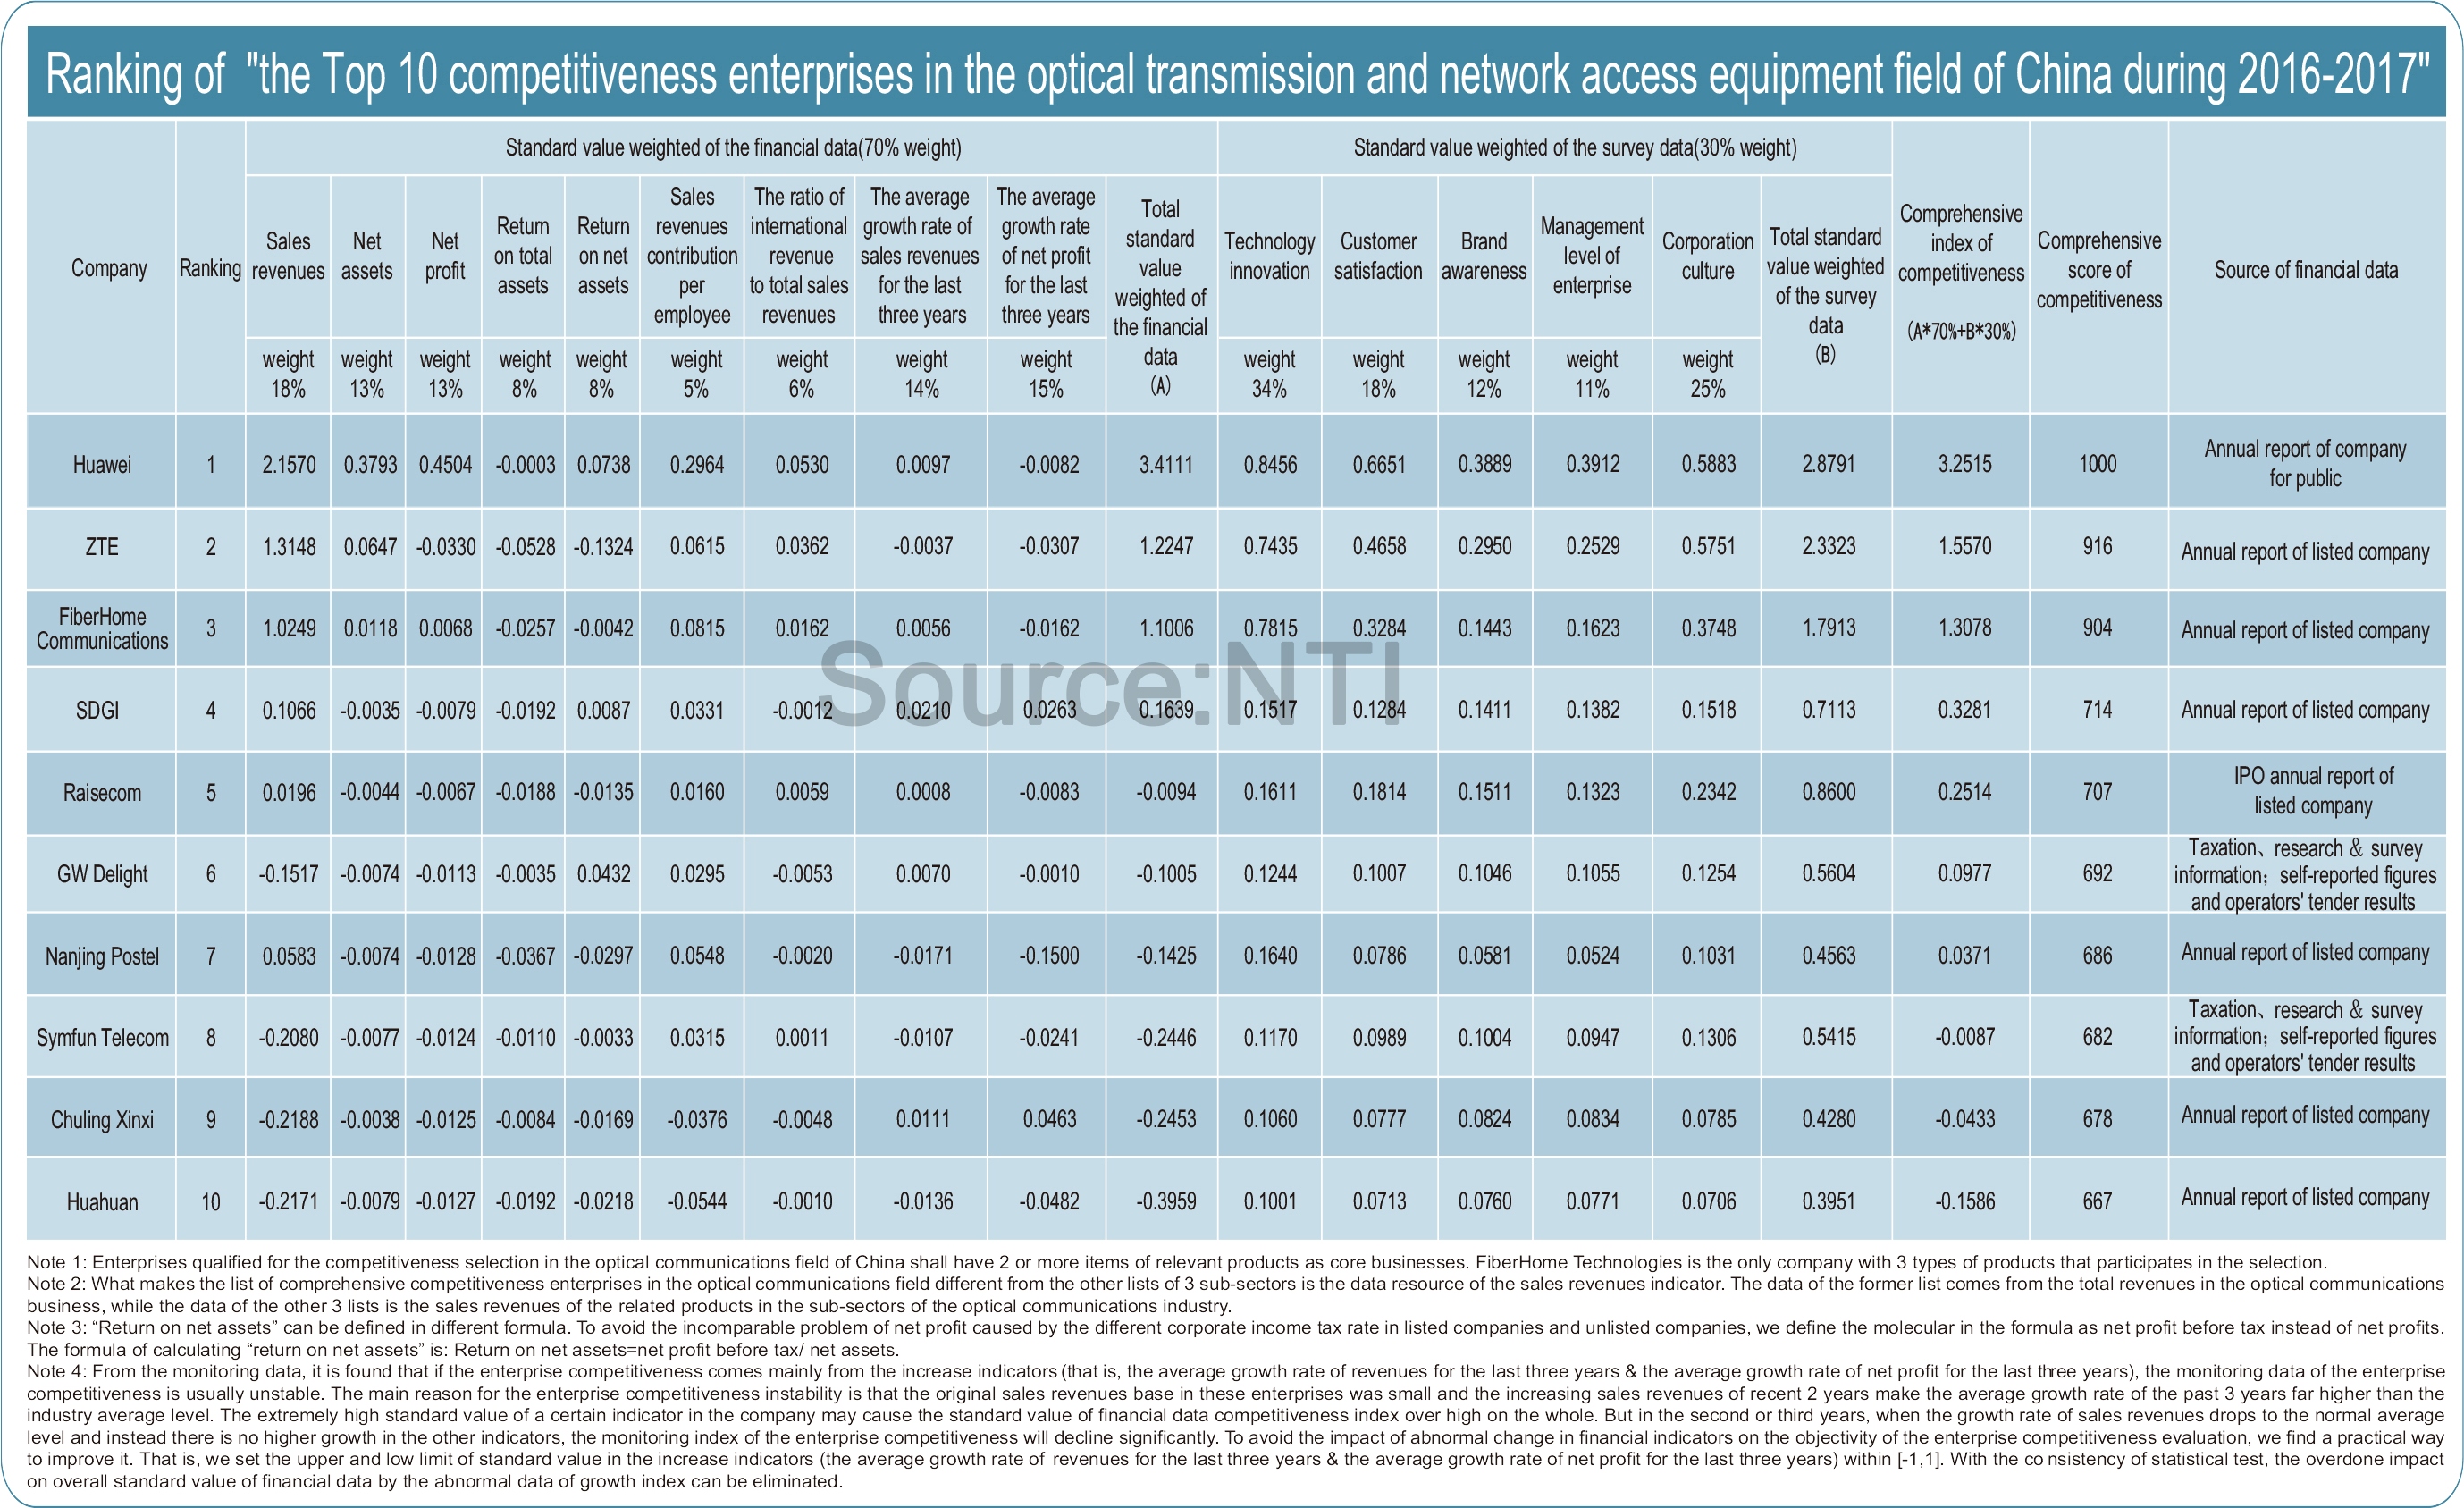
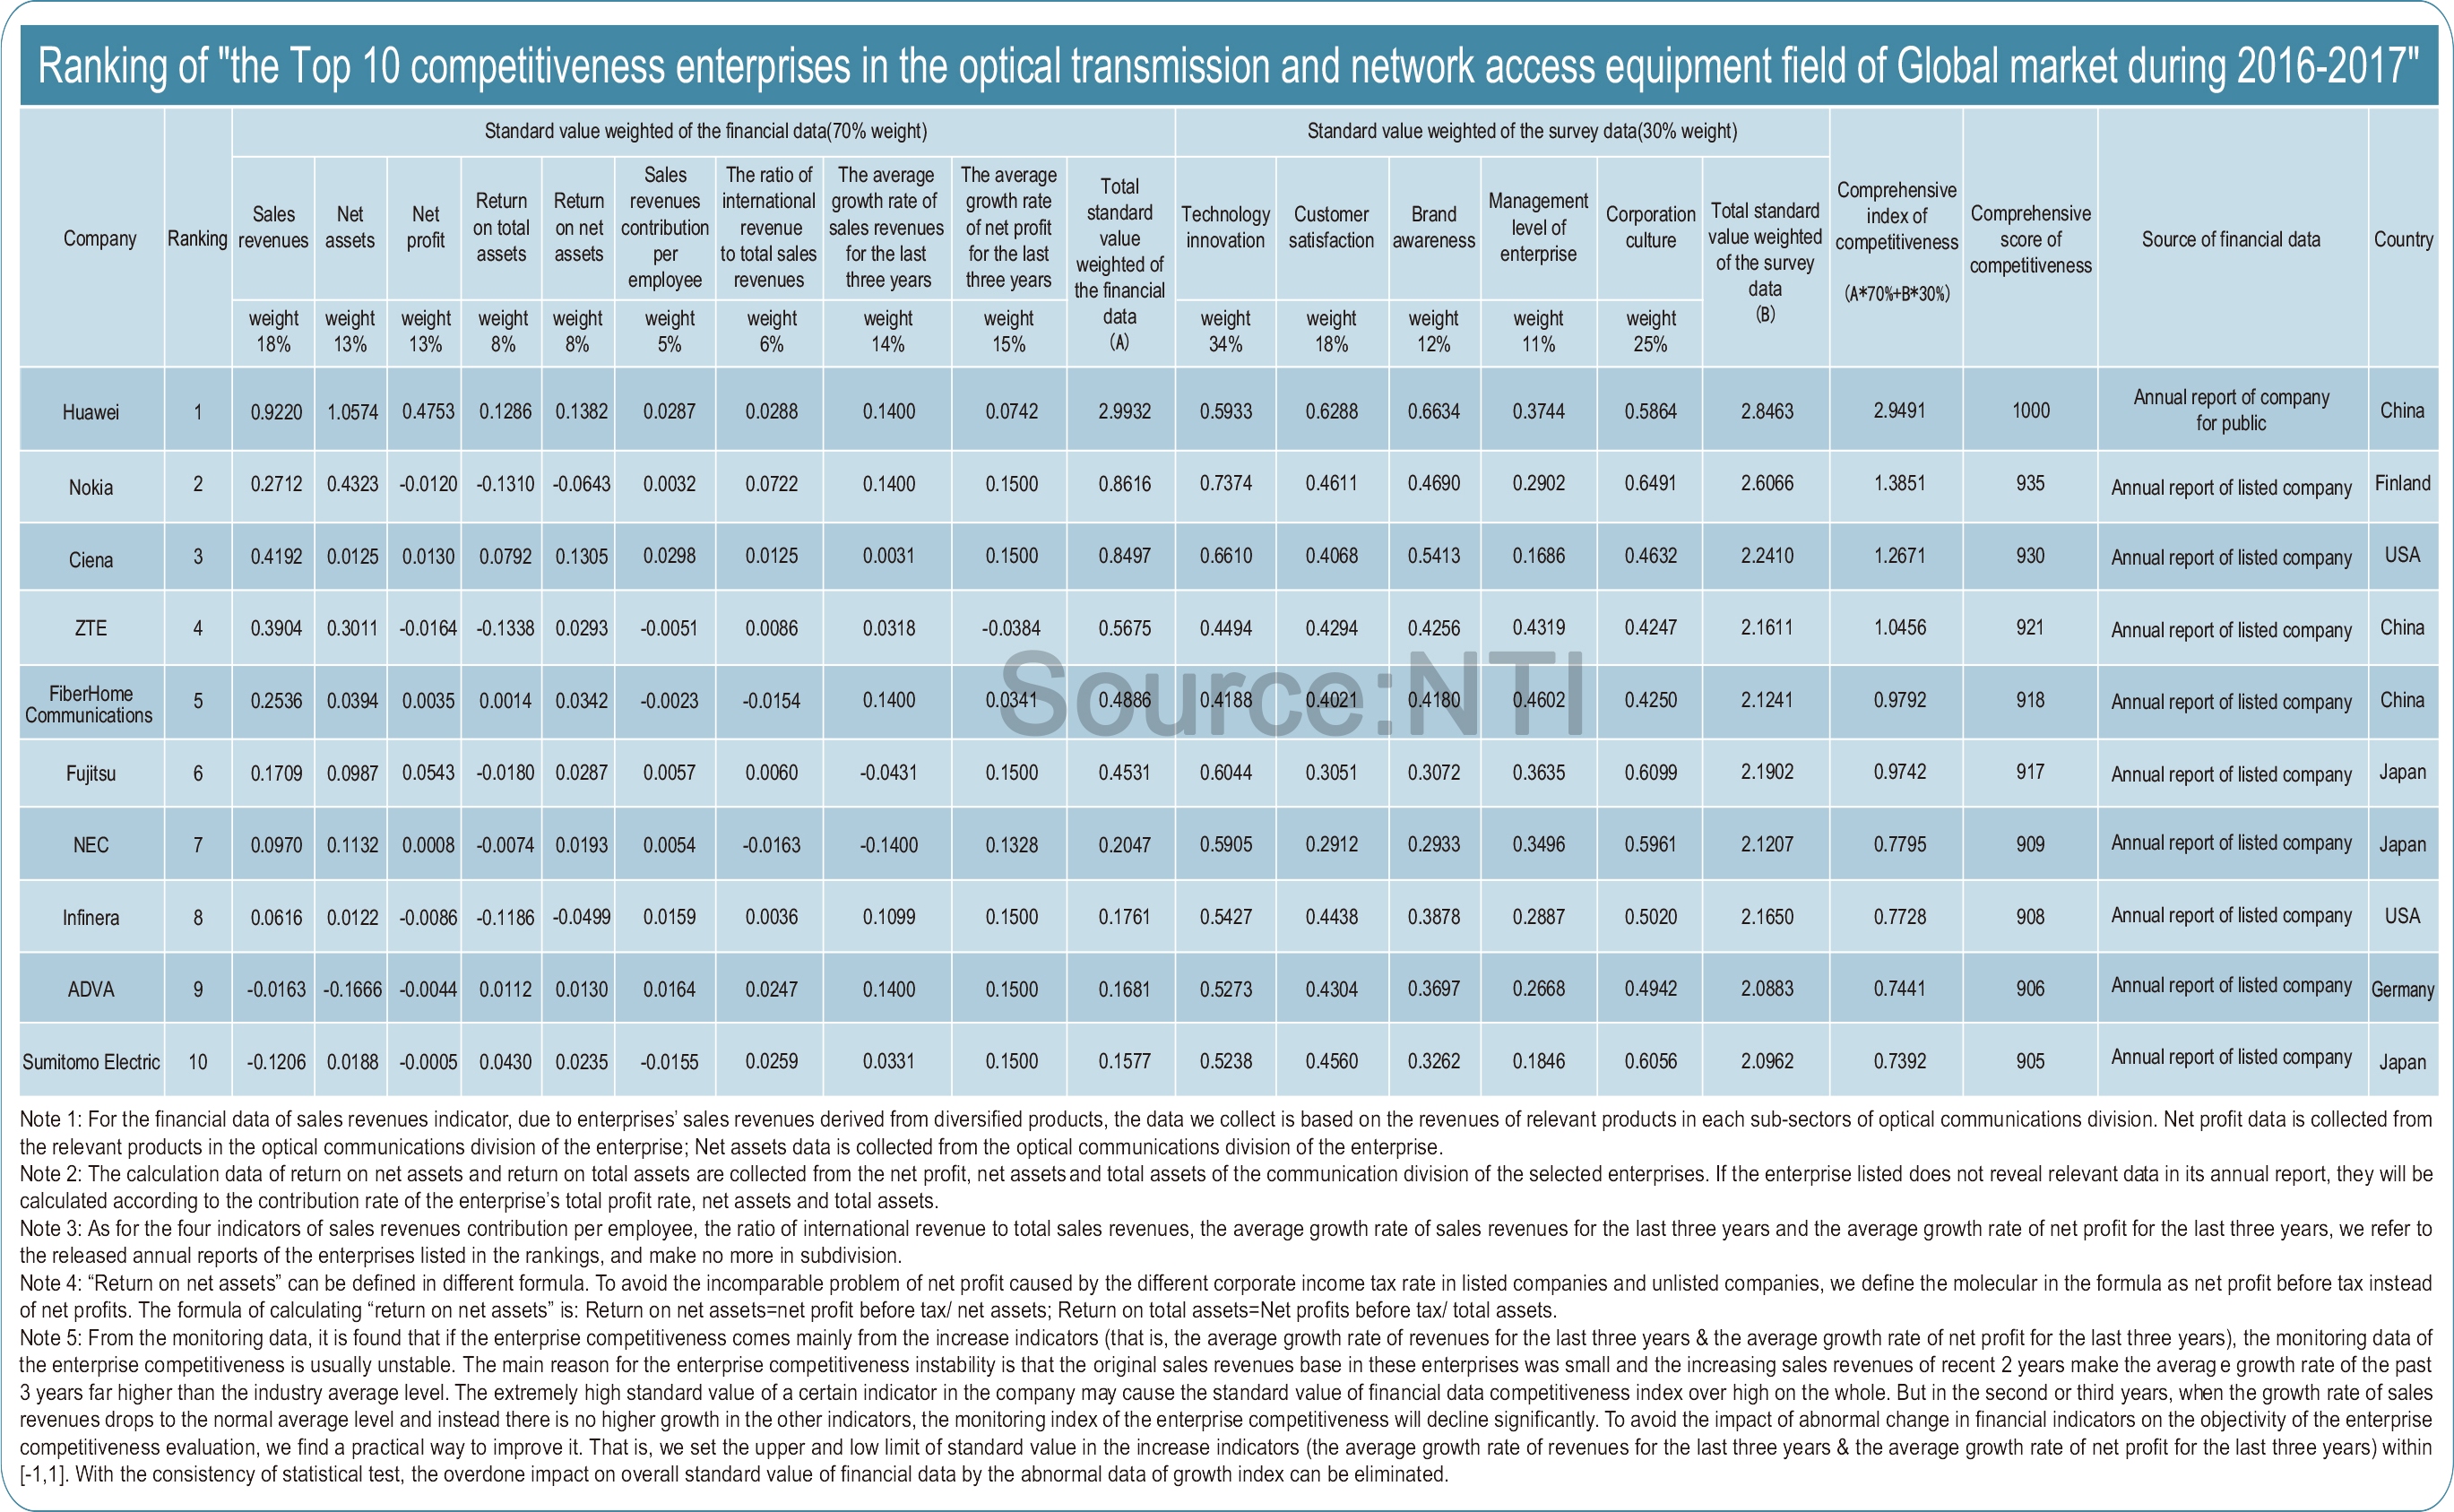
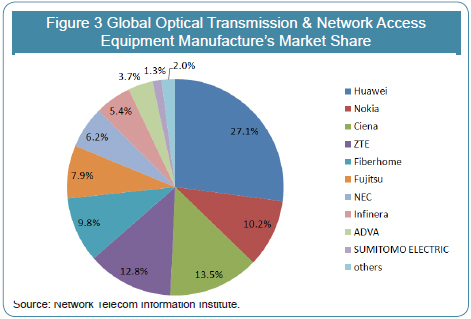
Viewing from the entire global optical transmission and network access equipment, Chinese enterprises make an impressive performance. HUAWEI stabilizes its leading position by sharing 27.10% of global optical transmission and network access equipment. Nokia locates number 2 with its 10.2% of market share. Ciena is listed number 3 with its 12.8% market share. ZTE is in number 4 location, less 0.6% than Ciena. And Fiberhome Communication is in number 5 location with its market share of 9.8%. Fujitsu, NEC, Infinera, ADVANCE, SUMITOMO ELECTRIC respectively take up 7.9%,6.2%, 5.4%, 3.7% and 1.3% of market share. These 10 enterprises totally cover 98% of global optical transmission and network access equipment market share.
 |
Optical network and transmission equipment is a sub-industry with high industrial centralization degree. In the last year, the five major equipment manufacturers’ revenue all realized positive growth, especially two domestic suppliers with over 10% growth. While on net profit aspect only Nokia showed loss situation. HUAWEI is the leader in this field,which has been listed 1st for many years, and is expanding its advantages.
With the multiple advantages of technology, cost and service, many major enterprises such as HUAWEI, ZTE developed rapidly. They kept leading domestic market and on the other way actively developing international market and seizing market share of abroad traditional old brand telecommunication equipment enterprises, becoming the backbone of global optical communication industry. It is understood that currently domestic optical network equipment enterprises’ optical transmission and optical access equipment has been massively used by operators in Europe, South East Asia and Africa etc. Chinese optical network equipment enterprises begin to become international important forces.
At the same time, optical network equipment industry begins entering into the stage of oligopolistic competition.With the competition becoming more and more fierce, market share will further concentrate on leading enterprises, while the surviving environment of small and medium-sized manufacturers will become worse.
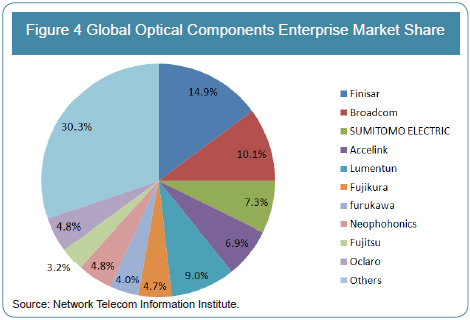
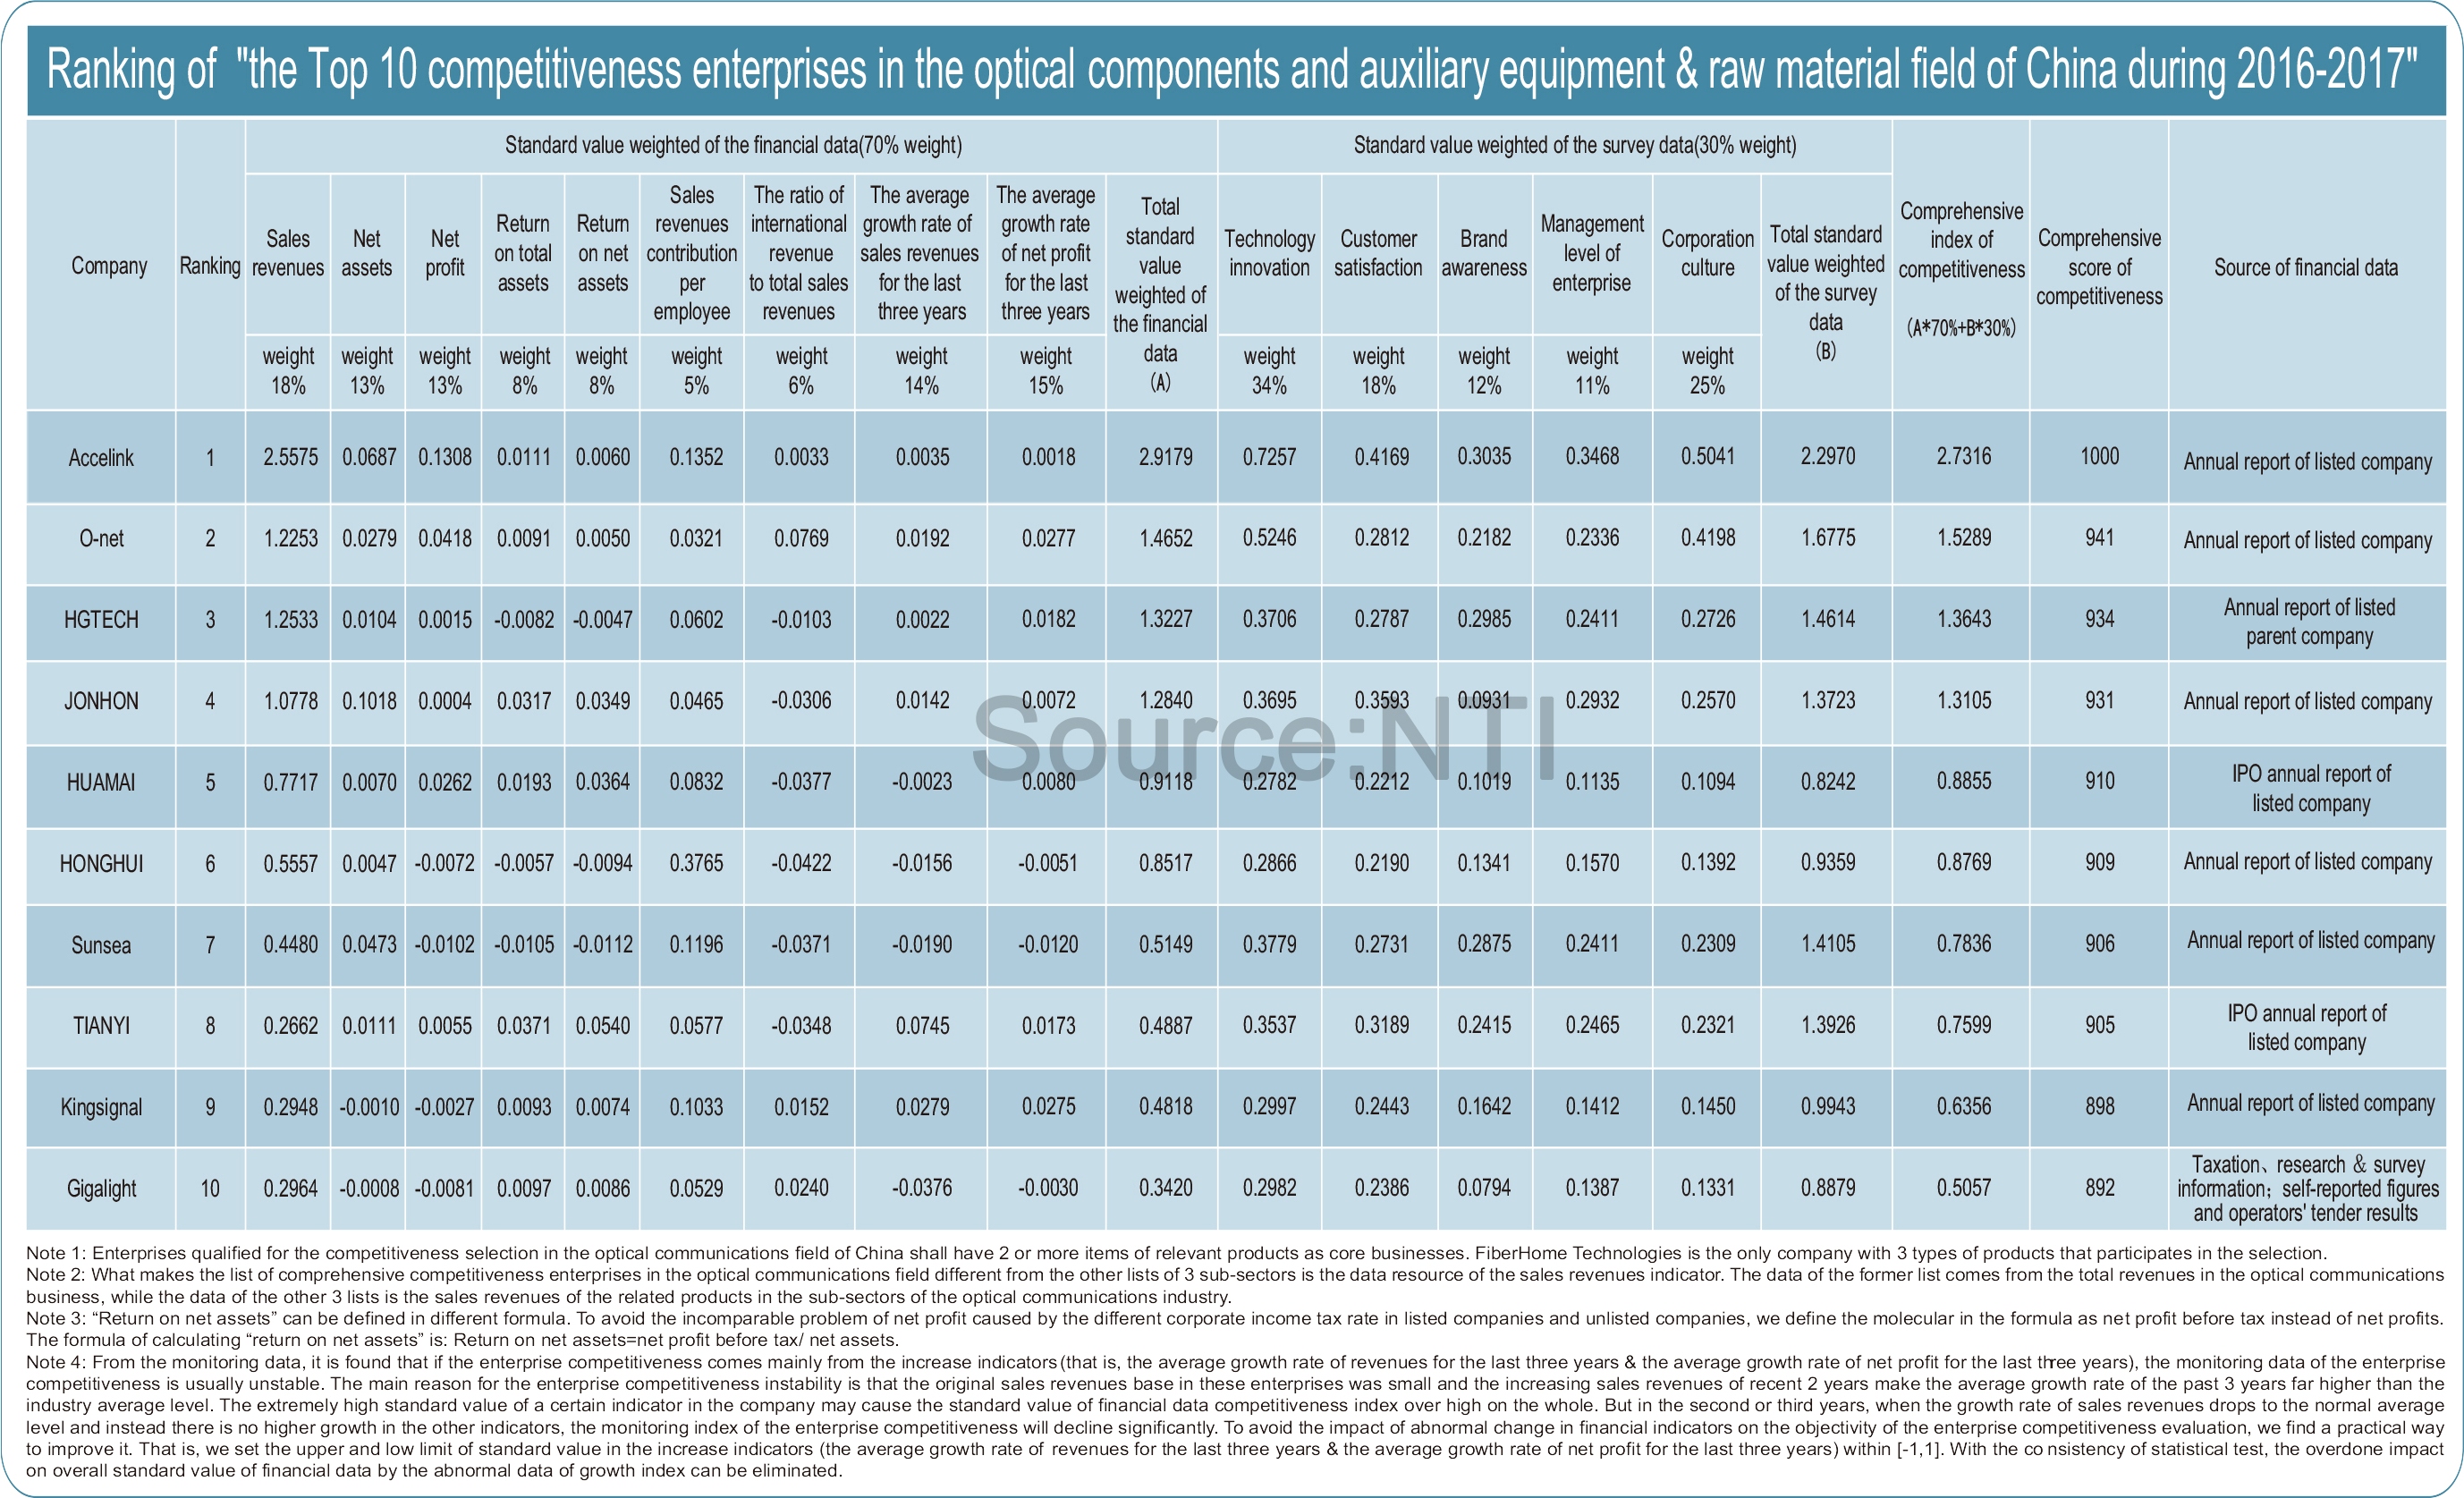
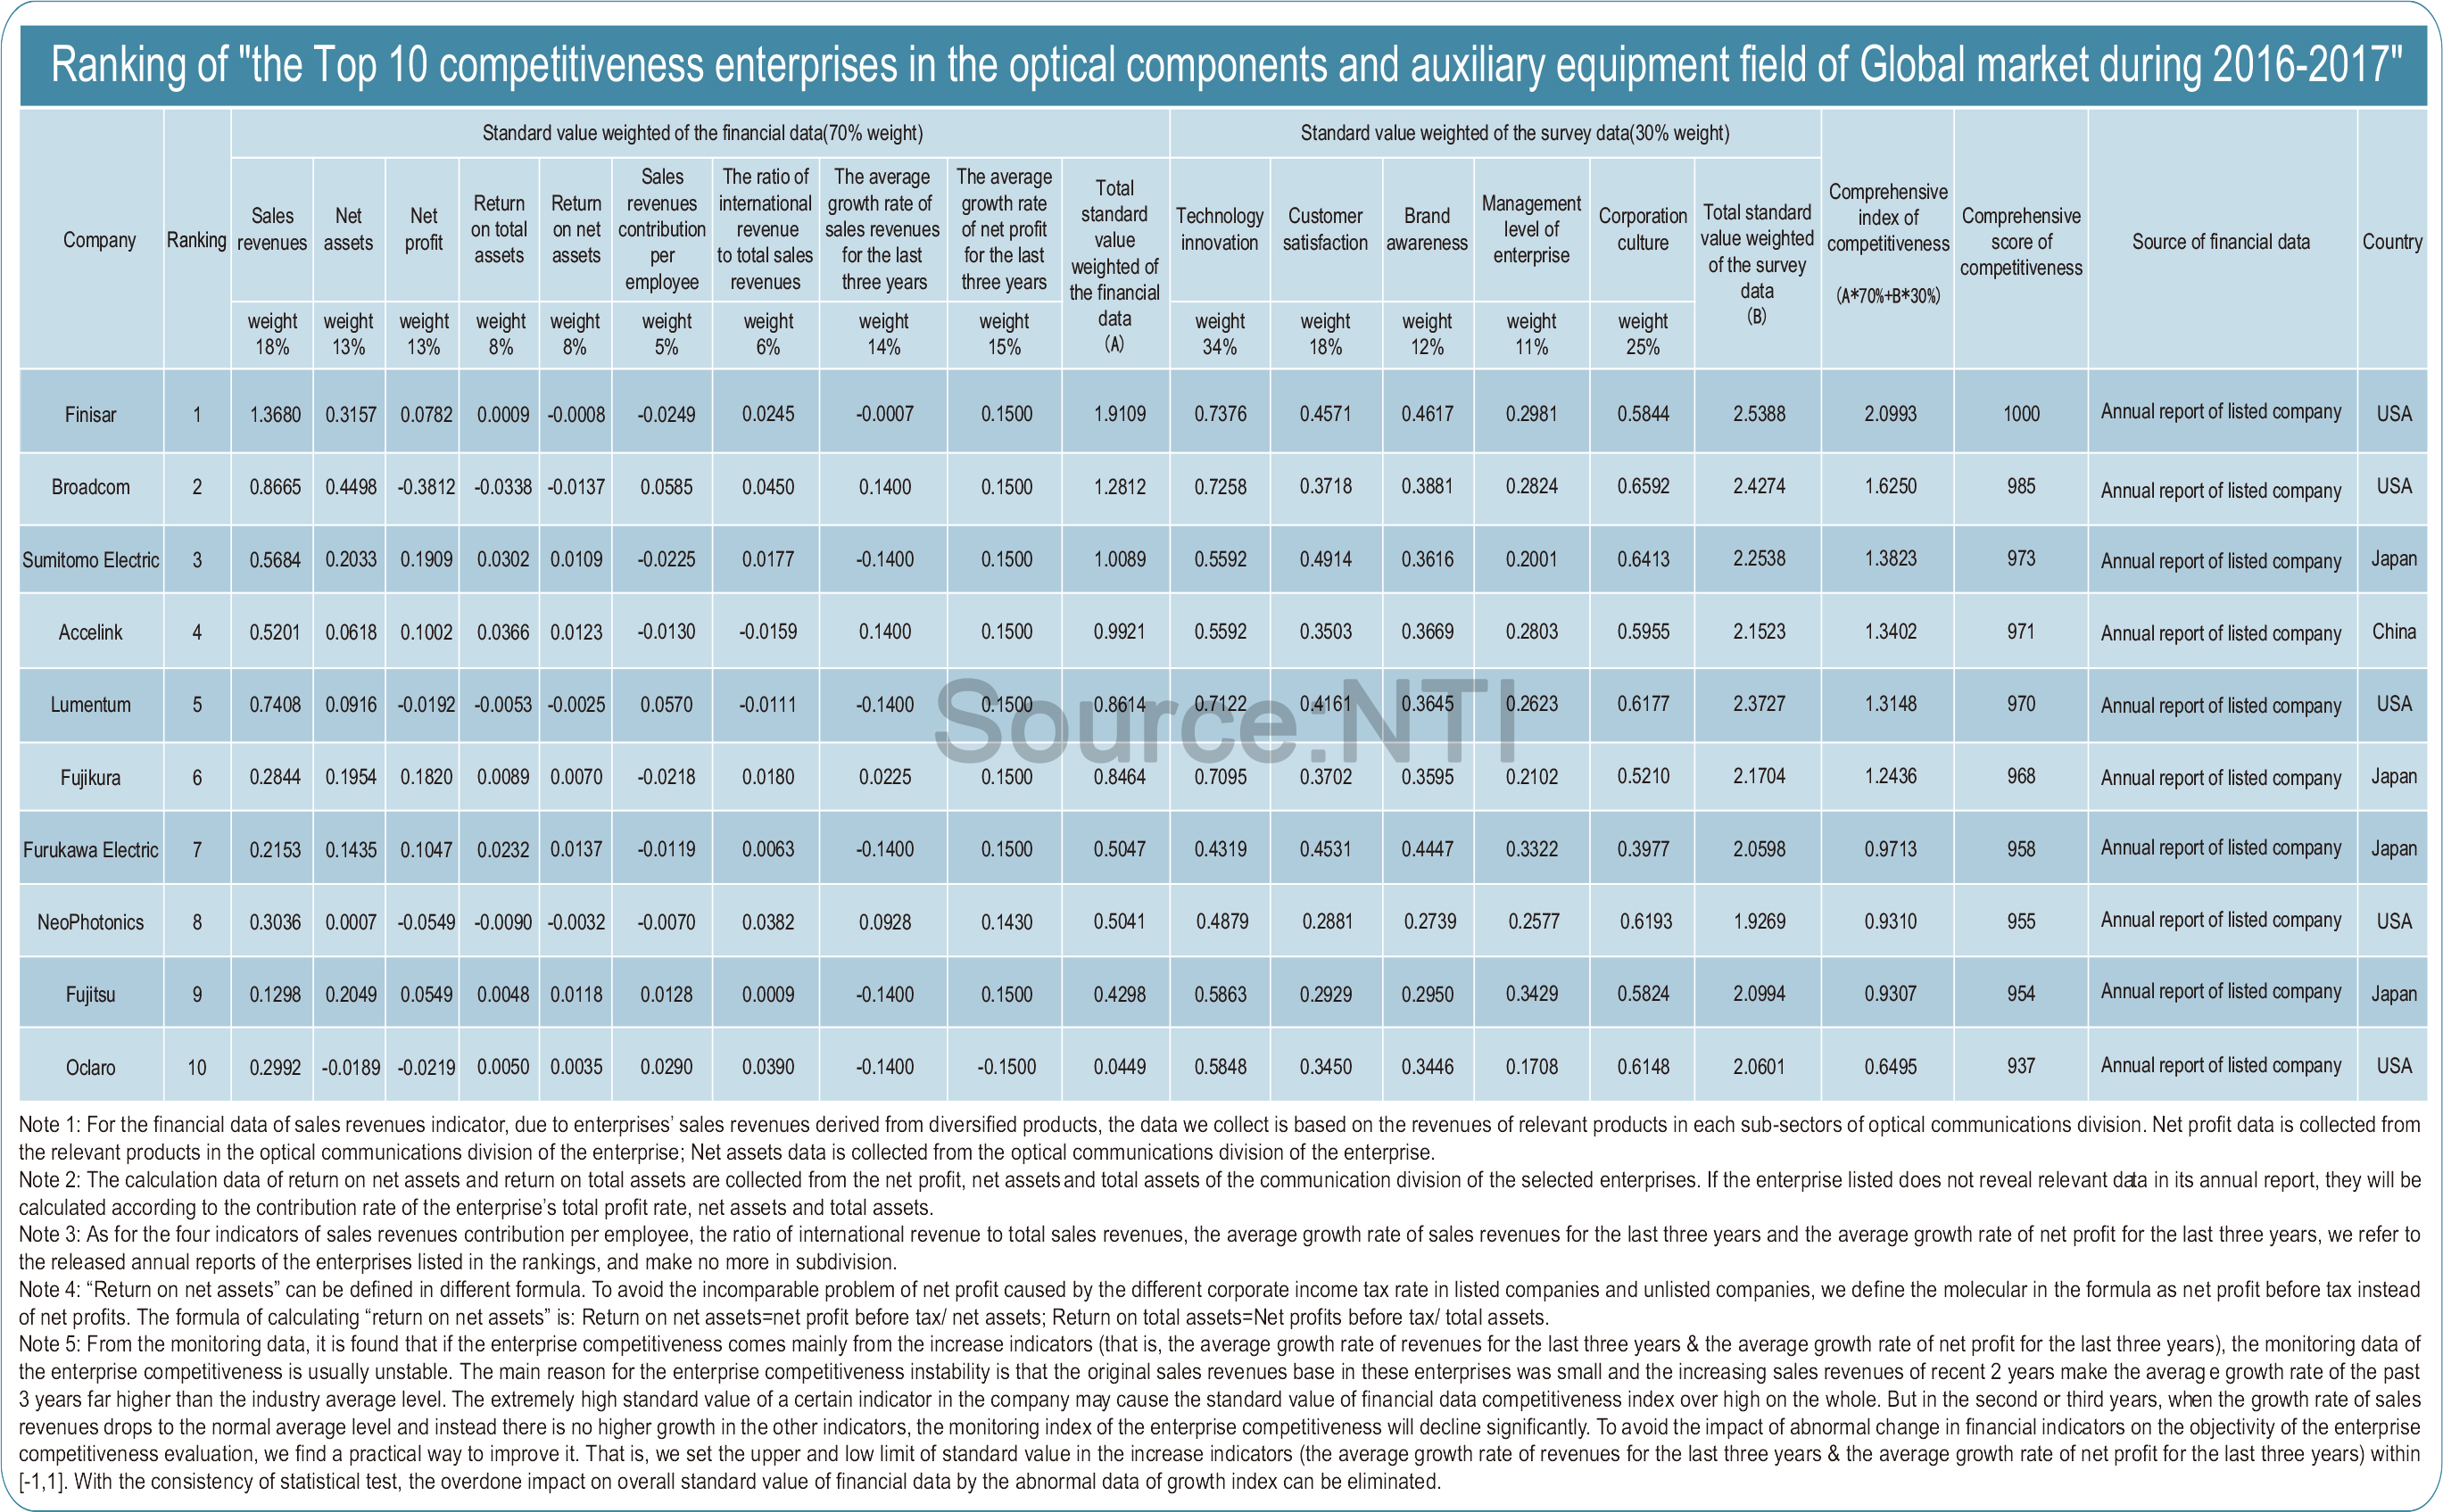
Optical components are the most competitive sub-industry in optical communication industry chain, and the top 10 global suppliers take up 69.7% of market share.
Optical communication components technology is necessary and strategic with perspectiveness, pioneer, and exploration in optical fiber communication industry, which shows a country’s technological innovation capability in optical fiber communication technology field. However, only a Chinese enterprise--Accelink enters and ranks 4th in the top 10 global optical components manufacturers, and there is a large gap in the overall strength compared with foreign giant enterprises.
Although 60% of optical components are manufactured by China, the sale volume of optical components only takes up 10% in the global optical components market. Viewing from its development, the concentration degree of optical components industry will gradually strengthen to match with the oligopolistic competition situation between optical communication equipment and optical fiber and cable.
Combined with new situations and requirements in optical fiber & cable market, Network Telecom Information Research Institute has researched China’s optical fiber & cable market and compiled industry prosperity index since in 2015 with the hope of exposure of the latest trend and offering valuable decision reference.
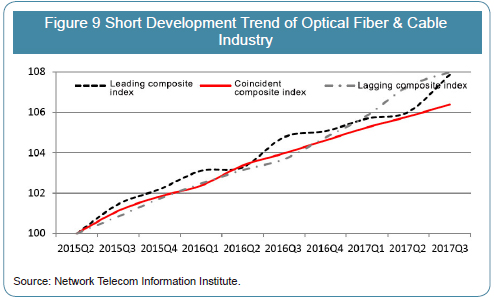
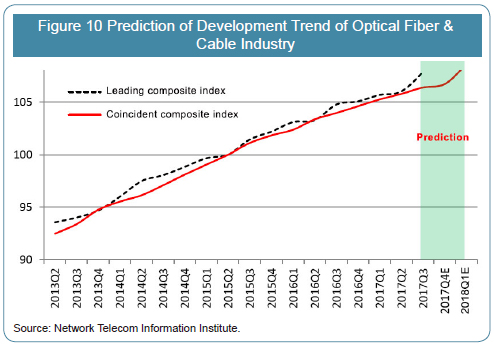
Industry prosperity index in 2017 shows that China’s optical fiber & cable market is still in a rapid development stage.Industry coincident composite index is 106.5 (Q2=100 in 2015, similarly hereinafter) in the third quarter in 2017,increasing by 0.61 than the previous quarter. The growth is obvious but the rate slowes down, increasing by 0.07. Leading composite index is 107.9 which increases by 1.84 than the previous quarter, and its rate increases by 1.6. Lagging composite index is 108.1, rising by 0.70 than the previous quarter. As both leading and coincident composite index are in the growing state,the optical fiber & cable industry in China will keep a fast development.
 |
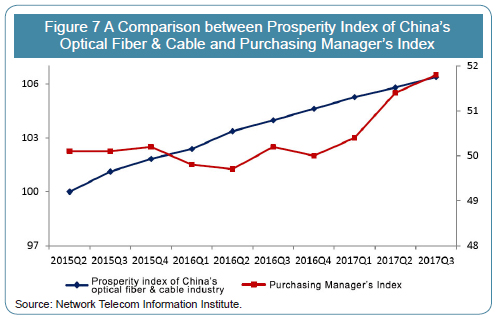
The trend of coordinate development is more and more evident between the optical fiber & cable industry and entity economy. The development of the optical fiber & cable, especially in-depth advancement of “Internet +”, exerted great impact on entity economy. Thus it became a long-debated issue. China’s Purchasing Manager’s Index (PMI) is usually regarded as a good sign of entity economy to measure the conditions of China’s manufacturing sector in production, new orders, products price, inventory, employees, order to deliver (OTD), new export orders as well as imports.
Figure 7 shows that the steady growth trend in China’s optical fiber & cable industry has been close to that in China’s Purchasing Manager’s Index since in 2015. As calculated, prosperity index of optical fiber & cable industry has existed an obvious positive correlation with Purchasing Manager’s Index from the second quarter in 2015 to the third quarter in 2017.Optical fiber & cable industry grows steadily, and the growth of entity economy is more evident, both of which generally have a positive trend, and the correlation coefficient is about 0.68. Therefore the trend of coordinate development is more and more evident between the optical fiber & cable industry and entity economy.
 |
Trend analysis of prosperity index
Prosperity index of China’s optical fiber & cable industry includes coincident index, leading index, and lagging index.Coincident index comprehensively reflects the overall trend of China’s optical fiber & cable industry, and leading index predicts the developing state in the future. Next we focus on the analysis of coincident and leading index.
1. Analysis of coincident index
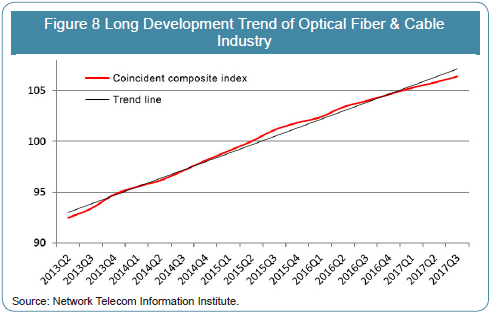
From the long perspective, coincident index keeps a steady growth. Fixed broadband, 4G network and other infrastructures speed up to upgrade, and market value of optical communication enterprises as well as revenue scale are gradually increasing.Internet integrating innovation remains to be active.
In the short term, coincident index grows steadily in the latest quarters. From the fourth quarter in 2016 to the third quarter in 2017, coincident index is respectively 104.63, 105.27, 105.81, and 106.40, increasing by 0.65, 0.65, 0.55, and 0.61 on quarter to quarter. The steady growth of coincident index demonstrates that China’s optical fiber & cable industry generally keeps a positive development trend.
The deepening Internet integration degree becomes an important reason why optical fiber & cable industry grows so fast as it’s an upstream industry.
 |
2. Analysis of leading index
Leading composite index continues to rise, and it is respectively 106.03 and 107.95 in the latest quarters, increasing by 0.34 and 1.84 on quarter to quarter, which shows that optical fiber & cable industry still has a strong potential.
Leading index predicts that China’s optical fiber & cable industry will continue to grow in the next two quarters. Analysis of peaks and troughs finds that the variation of both leading index and coincident index is regular and harmonious. And leading index averages 2 quarters lead over coincident index. As the following figure shows, leading index of China’s optical fiber & cable industry continues to maintain positive growth from the second quarter to the third quarter in 2017. Thus it’s predicted that China’s optical fiber & cable industry will continue to keep a steady growth in the next quarters (2017 Q4 - 2018 Q1).
 |
In the end, I’m honored to express my sincere gratitude to all partners in optical communication industry for their long-term help and support on behalf of all staffs of “ The Annual Top 10 Competitiveness Enterprises in the China/Global Optical Communication Field ”. Thank you!
Full-time Member of Standing Committee on Communication Technology of Ministry of Industry and Information Technology
Chairman of Asia-Pacific Optical Communications Committee
Chief Editor of "Network Telecom" Magazine
Sept 2017 |

Mao Qian |