
Page 42 - Market Analysis Report of Optical Communications Field in China & Global market 2025
P. 42
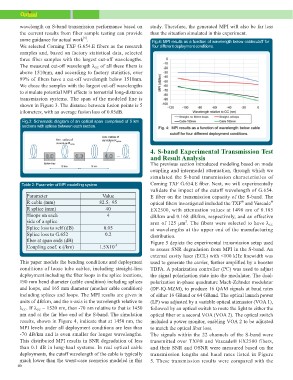
wavelength on S-band transmission performance based on          study. Therefore, the generated MPI will also be far less
the current results from fiber sample testing can provide       than the situation simulated in this experiment.
some guidance for actual work[5].
We selected Corning TXF G.654.E fibers as the research           Fig.4: MPl results as a function of wavelength below cablecutoff for
samples and, based on factory statistical data, selected         four different deployment conditions.
three fiber samples with the largest cut-off wavelengths.
The measured cut-off wavelength λCC of all these fibers is
above 1510nm, and according to factory statistics, over
99% of fibers have a cut-off wavelength below 1510nm.
We chose the samples with the largest cut-off wavelengths
to simulate potential MPI effects in terrestrial long-distance
transmission systems. The span of the modeled line is
shown in Figure 3. The distance between fusion points is 5
kilometers, with an average fusion loss of 0.05dB.

 Fig.3: Schematic diagram of an optical span comprised of 5 km
 sections with splices between each section.

Table 2: Parameter of MPI modelling system                      4. S-band Experimental Transmission Test
                                                                and Result Analysis
Parameter                                    Value
R cable (mm)                                82.5; 95            The previous section introduced modeling based on mode
R splice (mm)                                                   coupling and intermodal attenuation, through which we
#loops on each                                 40               simulated the S-band transmission characteristics of
side of a splice                                4               Corning TXF G.654.E fiber. Next, we will experimentally
Splice loss to self (dB)                                        validate the impact of the cutoff wavelength of G.654.
Splice loss to G.652                          0.05              E fiber on the transmission capacity of the S-band. The
fiber at span ends (dB)                        0.2              optical fibers investigated included the TXF® and Vascade®
Coupling coef. κ (/km)                                          EX2500, with attenuation values at 1490 nm of 0.185
                                            1.5X10⁻³            dB/km and 0.168 dB/km, respectively, and an effective
                                                                area of 125 µm2. The fibers were selected to have λCC
 This paper models the bending conditions and deployment        at wavelengths at the upper end of the manufacturing
 conditions of loose tube cables, including straight-line       distribution.
 deployment including the fiber loops in the splice locations,  Figure 5 depicts the experimental transmission setup used
 190 mm bend diameter (cable condition) including splices       to assess SNR degradation from MPI in the S-band. An
 and loops, and 165 mm diameter (another cable condition)       external cavity laser (ECL) with <100 kHz linewidth was
 including splices and loops. The MPI results are given in      used to generate the carrier, further amplified by a booster
 units of dB/km, and the x-axis is the wavelength relative to   TDFA. A polarization controller (PC) was used to adjust
 λCC. If λCC = 1520 nm, then -70 nm relative to that is 1450    the signal polarization state into the modulator. The dual-
 nm and at the far blue end of the S-band. The simulation       polarization in-phase quadrature Mach-Zehnder modulator
 results, shown in Figure 4, indicate that at 1450 nm, the      (DP-IQ-MZM), to produce 16 QAM signals at baud rates
 MPI levels under all deployment conditions are less than       of either 16 GBaud or 64 GBaud. The optical launch power
 -70 dB/km and is even smaller for longer wavelengths.          (LP) was adjusted by a variable optical attenuator (VOA 1),
 This distributed MPI results in SNR degradation of less        followed by an optical switch to route the light to either the
 than 0.1 dB in long-haul systems. In real optical cable        optical fiber or a second VOA (VOA 2). The optical switch
 deployments, the cutoff wavelength of the cable is typically   included a power monitor, enabling VOA 2 to be adjusted
 much lower than the worst-case scenarios modeled in this       to match the optical fiber loss.
                                                                The signals within the 22 channels of the S-band were
40                                                              transmitted over TXF® and Vascade® EX2500 fibers,
                                                                and their SNR and OSNR were measured based on the
                                                                transmission lengths and baud rates listed in Figure
                                                                5. These transmission results were compared with the