
Page 12 - Market Analysis Report of Optical Communications Field in China & Global market 2025
P. 12
10 The 19th Ranking Event of Top 10 Competitiveness Enterprises in the
Optical Communications of China & Global Market (2025)
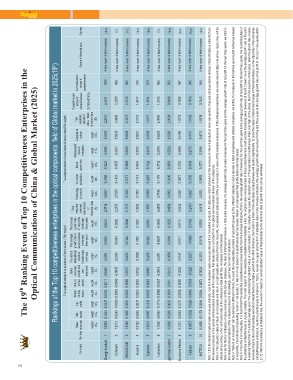
Rankings of the Top 10 competitiveness enterprises in the optical components field of Global market in 2025(19th)
The weighted standard value indexs of financial data 70% weight The weighted standard value indexs of survey data(30% weight)
Company Sales Net Net Return Return Sales The ratio of The average The average Total Technology Customer Brand Management Corporation Total Comprehensive Source of financial data Country
Ranking revenues assets profits on total on net revenues international growth rate of growth rate weighted innovation satisfaction awareness level of culture weighted indexs of Comprehensive
assets assets contribution revenue sales revenues of net profits standard enterprise standard
weight weight weight for the last value indexs value indexs competitiveness scores of
18% 13% 13% weight per to total sales for the last three years competitiveness
8% employee revenues three years of
(A*70%+B*30%)
weight financial data weight weight weight weight weight of survey data
weight weight weight weight (B)
8% 5% 6% 14% 15% (A) 34% 18% 12% 11% 25%
Zhongji Innolight 1 1.9920 0.1624 0.2227 0.0152 0.0211 0.0465 0.0351 0.0546 0.0214 2.5710 0.6657 0.3786 0.3221 0.3085 0.5300 2.2047 2.4611 1000 Annual report of listed company
Coherent 2 1.9713 0.3343 -0.0500 -0.0024 -0.0049 -0.0035 0.0032 0.0054 -0.0262 2.2272 0.7320 0.4423 0.4357 0.2931 0.5835 2.4866 2.3050 996 Annual report of listed company
BROADCOM 3 1.2396 0.1856 0.3597 0.0032 0.0089 0.2873 0.0232 0.0144 -0.0048 2.1172 0.7283 0.3777 0.3888 0.2836 0.6589 2.4373 2.2133 993 Annual report of listed company
Accelink 4 0.9132 0.0655 0.0273 0.0023 0.0035 0.0163 -0.0088 0.1400 0.1500 1.3093 0.7007 0.4113 0.4081 0.2910 0.6061 2.4172 1.6417 976 Annual report of listed company
Eoptolink 5 0.9613 0.0587 0.1216 0.0195 0.0283 0.0086 0.0290 0.0462 0.0355 1.3087 0.5009 0.3263 0.3122 0.2416 0.5368 1.9177 1.4914 970 Annual report of listed company
Lumentum 6 1.1058 0.0462 -0.1716 -0.0099 -0.0367 -0.0018 0.0201 -0.0297 -0.0665 0.8559 0.7186 0.4178 0.3712 0.2676 0.6252 2.4004 1.3193 965 Annual report of listed company
Ligent Hisense Broadband 7 0.5036 0.0269 0.0025 -0.0001 -0.0011 0.0121 -0.0065 -0.0180 -0.0225 0.4968 0.5602 0.3505 0.3502 0.2229 0.5200 2.0038 0.9489 953 Annual report of listed company
Sumitomo Electric 8 0.1241 0.0943 0.0127 0.0028 0.0050 -0.0235 0.0167 0.0011 0.0112 0.2442 0.5367 0.3977 0.3187 0.2068 0.5180 1.9778 0.7629 947 Annual report of listed company
Fujikura 9 0.0857 0.1032 0.0326 0.0045 0.0109 -0.0221 0.0237 -0.0086 0.0133 0.2433 0.4927 0.3736 0.3630 0.2133 0.4741 1.9166 0.7453 945 Annual report of listed company
HGTECH 10 0.3606 -0.1178 0.0209 0.0034 0.0073 -0.0024 -0.0212 -0.0118 0.0029 0.2419 0.4354 0.3854 0.3771 0.3349 0.4011 1.9338 0.7443 944 Annual report of listed company
Note 1: For the financial data of sales revenues indicator, due to enterprises’ sales revenues derived from diversified products, the data we collect is based on the revenues of relevant products in each sub-sectors of optical communications division. Net profit data is collected from
the relevant products in the optical communications division of the enterprise; Net assets data is collected from the optical communications division of the enterprise.
Note 2: The calculation data of return on net assets and return on total assets are collected from the net profit, net assetsand total assets of the communication division of the selected enterprises. If the enterprise listed does not reveal relevant data in its annual report, they will be
calculated according to the contribution rate of the enterprise’s total profit rate, net assets and total assets.
Note 3: As for the four indicators of sales revenues contribution per employee, the ratio of international revenue to total sales revenues, the average growth rate of sales revenues for the last three years and the average growth rate of net profit for the last three years, we refer to
the released annual reports of the enterprises listed in the rankings, and make no more in subdivision.
Note 4: “Return on net assets” can be defined in different formula. To avoid the incomparable problem of net profit caused by the different corporate income tax rate in listed companies and unlisted companies, we define the molecular in the formula as net profit before tax instead
of net profits. The formula of calculating “return on net assets” is: Return on net assets=net profit before tax/ net assets; Return on total assets=Net profits before tax/ total assets.
Note 5: From the monitoring data, it is found that if the enterprise competitiveness comes mainly from the increase indicators (that is, the average growth rate of revenues for the last three years & the average growth rate of net profit for the last three years), the monitoring data of
the enterprise competitiveness is usually unstable. The main reason for the enterprise competitiveness instability is that the original sales revenues base in these enterprises was small and the increasing sales revenues of recent 2 years make the averag e growth rate of the past
3 years far higher than the industry average level. The extremely high standard value of a certain indicator in the company may cause the standard value of financial data competitiveness index over high on the whole. But in the second or third years, when the growth rate of sales
revenues drops to the normal average level and instead there is no higher growth in the other indicators, the monitoring index of the enterprise competitiveness will decline significantly. To avoid the impact of abnormal change in financial indicators on the objectivity of the enterprise
competitiveness evaluation, we find a practical way to improve it. That is, we set the upper and low limit of standard value in the increase indicators (the average growth rate of revenues for the last three years & the average growth rate of net profit for the last three years) within
[-1,1]. With the consistency of statistical test, the overdone impact on overall standard value of financial data by the abnormal data of growth index can be eliminated.