
Page 10 - Market Analysis Report of Optical Communications Field in China & Global market 2025
P. 10
8 The 19th Ranking Event of Top 10 Competitiveness Enterprises in the
Optical Communications of China & Global Market (2025)
Rankings of the Top 10 competitiveness enterprises in the optical communications industry of Global market in 2025 (19th)
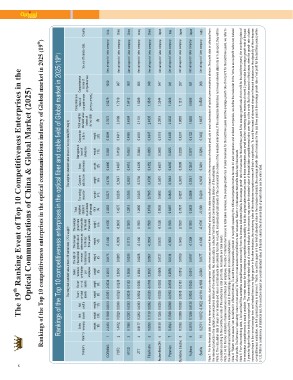
Rankings of the Top 10 competitiveness enterprises in the optical fiber and cable field of Global market in 2025 19th
The weighted standard value indexs of financial data 70% weight The weighted standard value indexs of survey data(30% weight)
Return Return Sales The ratio of The average The average Total Management Comprehensive
on total on net revenues international growth rate of growth rate weighted level of Total weighted indexs of Comprehensive
Company Sales Net Net assets assets contribution revenue sales revenues of net profits standard Technology Customer Brand enterprise Corporation standard value competitiveness scores of
Ranking revenues assets profits for the last value indexs innovation satisfaction awareness culture Source of financial data Country
weight per to total sales for the last three years of financial indexs of
weight weight weight 8% employee revenues three years competitiveness
18% 13% 13% survey data (A*70%+B*30%)
data weight weight weight weight weight
weight weight weight weight weight (B)
8% 5% 6% 14% 15% (A) 34% 18% 12% 11% 25%
CORNING 1 2.4454 0.1939 0.0613 -0.0001 -0.0038 0.0010 0.0175 -0.1400 -0.1500 2.4253 0.8371 0.4705 0.4996 0.3501 0.6099 2.7673 2.5279 1000 Annual report of listed company USA
YOFC 2 1.4412 0.0929 0.0088 -0.0023 -0.0239 0.0036 0.0083 -0.0009 -0.0903 1.4375 0.6336 0.5847 0.4897 0.4199 0.4911 2.6189 1.7919 967 Annual report of listed company China
HTGD 3 0.7080 0.2393 0.0383 0.0039 0.0153 0.0056 0.0039 0.1173 0.1500 1.2815 0.5385 0.5091 0.4810 0.4553 0.4965 2.4804 1.6412 960 Annual report of listed company China
ZTT 4 0.9177 0.2952 0.0393 0.0050 0.0055 0.0044 0.0028 -0.1400 0.1500 1.2800 0.5355 0.3704 0.4209 0.3804 0.4061 2.1131 1.5299 955 Annual report of listed company China
FiberHome 5 0.6095 0.1130 0.0092 -0.0025 -0.0169 0.0020 0.0067 -0.0004 0.1500 0.8708 0.7085 0.4500 0.4352 0.4053 0.4847 2.4835 1.3546 948 Annual report of listed company China
Furukawa Electric/OFS 6 0.9159 0.1355 0.0035 -0.0039 -0.0293 -0.0006 0.0137 0.0678 -0.1500 0.9526 0.6693 0.3401 0.4021 0.3688 0.5116 2.2918 1.3544 947 Annual report of listed company Japan
Prysmian 7 0.4824 0.1948 0.0096 -0.0009 -0.0003 0.0059 0.0134 -0.0053 0.1500 0.8497 0.4840 0.3843 0.4050 0.3255 0.4345 2.0333 1.2048 941 Annual report of listed company Italy
Sumitomo Electric 8 0.3590 0.0999 0.0039 0.0049 0.0103 -0.0012 0.0169 0.1400 0.1500 0.7837 0.4251 0.3670 0.3599 0.3326 0.4237 1.9083 1.1211 937 Annual report of listed company Japan
Fujikura 9 0.3574 0.1288 0.0136 0.0093 0.0525 -0.0011 0.0197 -0.1369 0.1500 0.5933 0.4288 0.3041 0.3047 0.3977 0.4132 1.8485 0.9698 931 Annual report of listed company Japan
Sterlite 10 0.2571 0.0072 -0.0022 -0.0114 -0.1085 -0.0001 0.0177 -0.1400 -0.1500 -0.1301 0.4209 0.3933 0.3481 0.3284 0.3432 1.8337 0.4590 908 Annual report of listed company India
Note 1: For the financial data of sales revenues indicator, due to enterprises’ sales revenues derived from diversified products, the data we collect is based on the revenues of relevant products in each sub-sectors of optical communications division. Net profit data is collected from
the relevant products in the optical communications division of the enterprise; Net assets data is collected from the optical communications division of the enterprise.
Note 2: The calculation data of return on net assets and return on total assets are collected from the net profit, net assetsand total assets of the communication division of the selected enterprises. If the enterprise listed does not reveal relevant data in its annual report, they will be
calculated according to the contribution rate of the enterprise’s total profit rate, net assets and total assets.
Note 3: As for the four indicators of sales revenues contribution per employee, the ratio of international revenue to total sales revenues, the average growth rate of sales revenues for the last three years and the average growth rate of net profit for the last three years, we refer to
the released annual reports of the enterprises listed in the rankings, and make no more in subdivision.
Note 4: “Return on net assets” can be defined in different formula. To avoid the incomparable problem of net profit caused by the different corporate income tax rate in listed companies and unlisted companies, we define the molecular in the formula as net profit before tax instead
of net profits. The formula of calculating “return on net assets” is: Return on net assets=net profit before tax/ net assets; Return on total assets=Net profits before tax/ total assets.
Note 5: From the monitoring data, it is found that if the enterprise competitiveness comes mainly from the increase indicators (that is, the average growth rate of revenues for the last three years & the average growth rate of net profit for the last three years), the monitoring data of
the enterprise competitiveness is usually unstable. The main reason for the enterprise competitiveness instability is that the original sales revenues base in these enterprises was small and the increasing sales revenues of recent 2 years make the averag e growth rate of the past
3 years far higher than the industry average level. The extremely high standard value of a certain indicator in the company may cause the standard value of financial data competitiveness index over high on the whole. But in the second or third years, when the growth rate of sales
revenues drops to the normal average level and instead there is no higher growth in the other indicators, the monitoring index of the enterprise competitiveness will decline significantly. To avoid the impact of abnormal change in financial indicators on the objectivity of the enterprise
competitiveness evaluation, we find a practical way to improve it. That is, we set the upper and low limit of standard value in the increase indicators (the average growth rate of revenues for the last three years & the average growth rate of net profit for the last three years) within
[-1,1]. With the consistency of statistical test, the overdone impact on overall standard value of financial data by the abnormal data of growth index can be eliminated.