
Page 10 - Market Analysis Report of Optical Communications Field in China & Global market 2015
P. 10
10
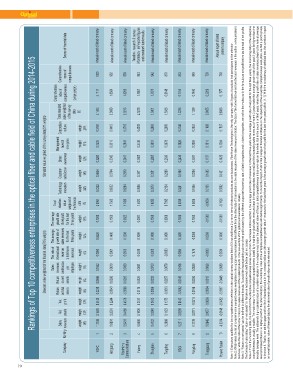
Rankings of Top 10 competitiveness enterprises in the optical fiber and cable field of China during 2014-2015
Standard value weighted of the financial data(70% weight) Standard value weighted of the survey data(30% weight)
Company Sales Net Net Return Return Sales The ratio of The average The average Total Technology Customer Brand Management Corporation Total standard Comprehensive Source of financial data
Ranking revenues assets profit on total on net revenues international growth rate of growth rate standard innovation satisfaction awareness level of culture value weighted index of Comprehensive
assets assets contribution revenue sales revenues of net profit value enterprise of the survey
weight weight for the last weighted of competitiveness score of
18% 13% per to total sales for the last three years the financial data competitiveness
employee revenues three years
$
%
%
weight weight weight weight weight weight weight data weight weight weight weight weight
$ 34% 18% 12% 11% 25%
13% 8% 8% 5% 6% 14% 15%
YOFC 1 1.1186 0.1693 0.4140 0.0235 0.0666 0.1042 0.0093 0.0426 0.1500 2.0981 0.7232 0.4656 0.3260 0.2525 0.3760 2.1433 2.1117 1000 Annual report of listed company
Hengtong 2 0.8891 0.2591 0.2244 -0.0040 0.0306 0.0610 0.0061 0.1400 0.1500 1.7563 0.6022 0.3704 0.3042 0.3516 0.4415 2.0699 1.8504 962 Annual report of listed company
1.8269
FiberHome 3 0.5401 0.4189 0.4578 -0.0008 0.0282 0.0309 0.0653 0.1208 0.0822 1.7434 0.8284 0.2919 0.2457 0.2841 0.3715 2.0216 1.5881 959 Annual report of listed company
Communications 1.5878 Taxationǃresearch ˂ survey
Futong 4 0.8000 0.1609 0.2197 0.0116 0.0325 0.0641 0.0039 0.1095 0.0001 1.4023 0.4858 0.3911 0.3805 0.3436 0.4205 2.0215 943 information˗self-reported figures
and operators' tender results
Zhongtian 5 0.6122 0.3249 0.2613 0.0086 0.0202 0.0703 0.0380 0.1400 0.1500 1.6255 0.3078 0.3051 0.2885 0.3001 0.2986 1.5001
942 Annual report of listed company
Tongding 6 0.2888 0.1123 0.1375 -0.0010 0.0257 0.0079 -0.0083 0.1400 0.0066 0.7095 0.2154 0.2888 0.2836 0.3078 0.2980 1.3936 0.9148 870 Annual report of listed company
SDGI 7 0.2211 0.0295 0.0143 -0.0062 0.0149 0.0106 0.0094 0.1400 0.1500 0.5836 0.3261 0.1966 0.2435 0.1828 0.2746 1.2236 0.7756 853 Annual report of listed company
Yongding 8 0.1139 0.0771 -0.0218 0.0188 0.0359 0.0959 0.1478 -0.0350 0.1500 0.5826 0.1806 0.2284 0.2241 0.2056 0.2952 1.1339 0.7480 849 Annual report of listed company
Tongguang 9 0.0645 0.0077 -0.0056 -0.0054 0.0012 0.0068 -0.0099 0.0268 -0.1500 -0.0639 0.2155 0.1665 0.1737 0.1610 0.1888 0.9055 0.2269 793 Annual report of listed company
Potevio Fasten 10 -0.0314 -0.0148 -0.0482 -0.0357 -0.0448 0.0089 0.0634 0.1400 -0.1500 -0.1126 0.3062 0.1421 0.1429 0.1384 0.1587 0.8883 0.1877 788 Annual report of listed
parent company
Note 1: Enterprises qualified for the competitiveness selection in the optical communications field of China shall have 2 or more items of relevant products as core businesses. FiberHome Technologies is the only company with 3 types of products that participates in the selection.
Note 2: What makes the list of comprehensive competitiveness enterprises in the optical communications field different from the other lists of 3 sub-sectors is the data resource of the sales revenues indicator. The data of the former list comes from the total revenues in the optical communications
business, while the data of the other 3 lists is the sales revenues of the related products in the sub-sectors of the optical communications industry.
Note 3: “Return on net assets” can be defined in different formula. To avoid the incomparable problem of net profit caused by the different corporate income tax rate in listed companies and unlisted companies, we define the molecular in the formula as net profit before tax instead of net profits.
The formula of calculating “return on net assets” is: Return on net assets=net profit before tax/ net assets.
Note 4: From the monitoring data, it is found that if the enterprise competitiveness comes mainly from the increase indicators (that is, the average growth rate of revenues for the last three years & the average growth rate of net profit for the last three years), the monitoring data of the enterprise
competitiveness is usually unstable. The main reason for the enterprise competitiveness instability is that the original sales revenues base in these enterprises was small and the increasing sales revenues of recent 2 years make the average growth rate of the past 3 years far higher than the
industry average level. The extremely high standard value of a certain indicator in the company may cause the standard value of financial data competitiveness index over high on the whole. But in the second or third years, when the growth rate of sales revenues drops to the normal average
level and instead there is no higher growth in the other indicators, the monitoring index of the enterprise competitiveness will decline significantly. To avoid the impact of abnormal change in financial indicators on the objectivity of the enterprise competitiveness evaluation, we find a practical way
to improve it. That is, we set the upper and low limit of standard value in the increase indicators (the average growth rate of revenues for the last three years & the average growth rate of net profit for the last three years) within [-1,1]. With the co nsistency of statistical test, the overdone impact
on overall standard value of financial data by the abnormal data of growth index can be eliminated.